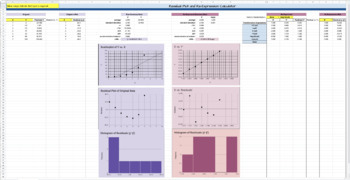
APStat: Residual and Re-expression Calculator
- Google Sheets™

Description
In AP Statistics, re-expression variables to fit an LSRL can be cumbersome on the calculator, without any real benefit to the student. This calculator is programmed to help students to easily see the relationship between a scatterplot and its residual plot for both re-expressed and raw (x,y) data values. This is a great tool to help students explore the Ladder of Powers for non-linear scenarios.
The only values that need to be input are the raw data points. Students can also select the transformations for X and Y and also, which variable they would like to compare the residual plot to (x/x' or y/y').
Here is a quick video of what it can do: https://youtu.be/wqO10S4zBMc
After purchase, feel free to email me (jackie.puleio@gmail.com) if you have any questions about how it works once you're in there.


