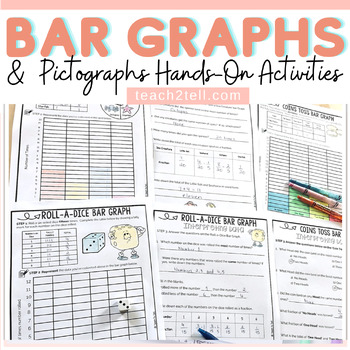
Bar Graphs Worksheets & Bar Graphs Activities Pictographs Picture Graphs
- Zip
What educators are saying
Also included in
- Are you looking for a comprehensive Math Curriculum bundle that includes a variety of resources and activities that cover 4th Grade, 5th Grade, and 6th Level standards?This Math Curriculum Bundle has a range of print and digital resources to teach and reinforce key math concepts aligned to the stanPrice $58.50Original Price $116.10Save $57.60
- 1. BAR GRAPHS ⭐ Separate folders featuring both British English and American spellings and terminology included.***********************************************************************This graphing unit features interpreting data in bar graphs and pictographs. Data iscollected using concrete materialPrice $7.00Original Price $9.00Save $2.00
- The graphing bundle features interactive activities for creating and interpreting bar graphs, pictographs, line graphs, line plots and pie charts. Your entire graphing unit for a year!Separate folders featuring both British English and US spellings and terminology included.Great quality and value foPrice $25.00Original Price $34.60Save $9.60
Description
This collection of interactive worksheets feature interpreting data in bar graphs and pictographs. Data is collected using concrete materials such as visuals, dice, spinners, coins and M&M’s. This data is then represented in bar graphs and interpreted. The section on pictographs requires collected data to be interpreted.
US and British English spellings and terminology files included.
These no-prep printables facilitate students to move from the concrete to the abstract. Graphs target students of different ability levels and are categorized into two main sections: Pictographs and Bar Graphs
Items Included
1. Cover Sheets x 2 (if compiling all pages into a booklet for students)
2. Section on Pictographs
The following pictographs are featured in this section. All graphs include questions that interpret collected data and symbols representing votes.
- Cupcakes Sold Pictograph
- Favorite Excursion Pictograph
- Bus Arrivals Pictograph
- Soccer Match Pictograph
- Pocket Money Spent Pictograph
- Ice-cream Sales Pictograph
- School Lunch Choices Pictograph
- Bake Sale Fundraiser Pictograph
- Favorite Pets Pictograph
► 3. Section on Bar Graphs
The following bar graphs are contained in this section. All graphs include questions that interpret collected data.
- Lolly Bar Graph
- Roll-a-Dice Bar Graph
- Spin a Color Bar Graph
- Spin a Sea Creature Bar Graph
- M&M’s Bar Graph
- Coin Toss Bar Graph
- Animals on a Farm Bar Graph
- Animals at the Aquarium Bar Graph
- Library Books Check Out Bar Graph
► 4. Vocabulary Display Cards
This section contains vocabulary cards featuring mathematical language used when working with bar graphs.
Also Included in:
Resources of Interest
- Math Practice Tests Bundle
- Naplan Numeracy Practice Tests Bundle
- Math Curriculum (K-3) Bundle
- Chance and Probability Bundle
- Factors and Multiples Bundle
Thank you for visiting Teach2Tell. New resources are 50% off - do follow the store to get notified :)
Please contact me with any queries regarding this resource.
Thank you!
Laurane@teach2tell.com


