
Box and Whiskers Plot Activity with Real World Data Comparisons


- PDF
What educators are saying
Also included in
 Do you love discovery learning, collaboration, hands-on activities, and projects that help students make sense of the math they are learning? This curriculum is packed with engaging and challenging Algebra I and 8th grade math resources for the whole year. A variety of activities, inquiry learningPrice $350.00Original Price $677.94Save $327.94
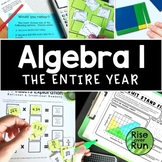 This curriculum bundle includes a variety of activities, assessments, games, group activities, projects, inquiry lessons, guided notes, and more for teaching Algebra I CCSS standards. The activities are centered on discovery learning and engaging activities with real world connections. Lessons helpPrice $225.00Original Price $445.21Save $220.21
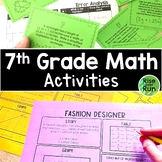 Looking for seventh grade math resources that are engaging, meaningful, standards-based, and help build conceptual understanding? In this big pack are over 50 resources that include hands-on learning, card sorts, games, projects, collaborative group activities, and more! These activities are rigorouPrice $95.00Original Price $145.22Save $50.22
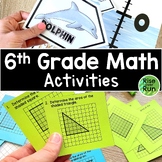 Looking for sixth grade math resources that are engaging, meaningful, standards-based, and help build conceptual understanding? In this big pack are 35+ resources that include hands-on learning, card sorts, games, projects, group activities, and more! These activities are rigorous and engaging. AsPrice $73.00Original Price $109.25Save $36.25
 No more boring box plot lessons! These activities are engaging and will help your students see how box plots are really useful with real world data. Grab these 5 resources, print, and be ready to go! Here are the resources included in this bundle:Box & Whiskers Real World Temperature LessonIn tPrice $9.00Original Price $15.50Save $6.50
Description
Help students understand how and why to use box & whiskers plots with this real world application using data about temperatures in different cities.
Students use data about the highest average temperature for each month in a city. They locate it on a world map and then create a vertical box plot using the vertical number line provided. Once students create their individual cities’ box plots, all the data can be displayed on a wall for comparison. This leads to some great discussions about the shape and spread of data.
Here’s what is included:
- Activity Guide
- Data for 30 different cities (12 temperatures each)
- Student sheets for creating a box & whisker plot (These print 2 per page.)
- Discussion question suggestions & extension ideas
- A key showing the minimum, 1st quartile, median, 3rd quartile, and maximum for the 30 given cities (to save you time checking work!)
This is a great way to incorporate geography with math.
Vertical box plots are utilized because they are often used in real data displays. The vertical arrangement also makes sense visually for temperature comparisons.
Students may wonder why they would ever need to create a box plot or what they are used for. This lesson shows them how useful the visual of a box & whiskers plot can be!
