
End of the Year Real World Math Project - Graphing Linear Equations


- PDF
What educators are saying
Also included in
 If you enjoy teaching students using discovery learning and engaging activities with real world connections, this huge pack of resources is here to help you plan your entire year of 8th grade math.Lessons help you teach the standards, encourage discussions, and challenge students to think. StudentsPrice $225.00Original Price $386.46Save $161.46
 Do you love discovery learning, collaboration, hands-on activities, and projects that help students make sense of the math they are learning? This curriculum is packed with engaging and challenging Algebra I and 8th grade math resources for the whole year. A variety of activities, inquiry learningPrice $350.00Original Price $677.94Save $327.94
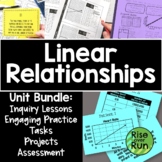 Want linear functions lessons that are engaging to students and have real world applications? This unit is packed with tasks activities to help your students understand graphing linear equations!Included topics:Proportional RelationshipsSlopeSlope-Intercept FormPoint-Slope FormStandard FormThe activPrice $42.00Original Price $58.50Save $16.50
 This curriculum bundle includes a variety of activities, assessments, games, group activities, projects, inquiry lessons, guided notes, and more for teaching Algebra I CCSS standards. The activities are centered on discovery learning and engaging activities with real world connections. Lessons helpPrice $225.00Original Price $445.21Save $220.21
 Want to incorporate more PBL in your lessons? Challenge students to use what they have learned in class as they apply 8th grade standards in these real world application projects. Included are 6 engaging projects:Rates & Proportional Relationships Business Startup ProjectTransformations ArchitPrice $14.00Original Price $20.49Save $6.49
Description
Challenge your students to work with real world linear relationships in these three differentiated, engaging projects.
Each project requires students to graph lines, create tables of values, write equations, interpret graphs, compare rates, and compare initial values. The projects increase in difficulty by providing information in different formats, asking more in-depth questions, and allowing creativity. The last project also introduces students to systems.
Differentiation can be difficult and time-consuming. If you are working with linear functions and know your students have varying levels of understanding, these projects are a great solution. A guide is provided with a list of skills required for each project.
A scoring rubric and answer keys are provided too.
Common Core Standards:
8.F.A.2 Compare properties of two functions each represented in a different way (algebraically, graphically, numerically in tables, or by verbal descriptions).
8.F.A.4 Construct a function to model a linear relationship between two quantities. Determine the rate of change and initial value of the function from a description of a relationship or from two (x, y) values, including reading these from a table or from a graph. Interpret the rate of change and initial value of a linear function in terms of the situation it models, and in terms of its graph or a table of values.
8.F.A.5 Describe qualitatively the functional relationship between two quantities by analyzing a graph (e.g., where the function is increasing or decreasing, linear or nonlinear). Sketch a graph that exhibits the qualitative features of a function that has been described verbally.
