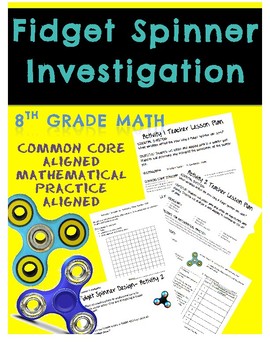
Fidget Spinner Math Investigation Scatter Plots and Data Displays
Middle and Secondary Math Maddness
6 Followers
Grade Levels
6th - 9th
Subjects
Resource Type
Standards
CCSS8.SP.A.1
Formats Included
- PDF
Pages
14 pages
Middle and Secondary Math Maddness
6 Followers
Description
This pack contains two awesome activities involving the latest fad that is driving teachers CRAZY in middle school classrooms: FIDGET SPINNERS:
TWO Activities are contained in this pack!
Activity 1 is geared towards 8th grade students who have already studied scatter plots and interpreting correlations. In this activity students will collect data and compare the weight and time spinning of a fidget spinner. Materials required: scale, stop watch, and of course fidget spinners!
Activity 2 can be used with any students that are familiar with data displays. Students will collect data on the time spinning of fidget spinners and then choose how to display and analyze their data. Materials required: stop watch and of course, fidget spinners!
This activity is a great activity to keep your students engaged for a few days at the end of the school year!!!
A lesson plan is included for each activity complete with the essential questions, objectives, standards and mathematical practices, vocabulary, launch, and closure.
These activities are common core and mathematical practice aligned.
HAPPY SPINNING!
Total Pages
14 pages
Answer Key
N/A
Teaching Duration
2 hours
Report this resource to TPT
Reported resources will be reviewed by our team. Report this resource to let us know if this resource violates TPT’s content guidelines.
Standards
to see state-specific standards (only available in the US).
CCSS8.SP.A.1
Construct and interpret scatter plots for bivariate measurement data to investigate patterns of association between two quantities. Describe patterns such as clustering, outliers, positive or negative association, linear association, and nonlinear association.


