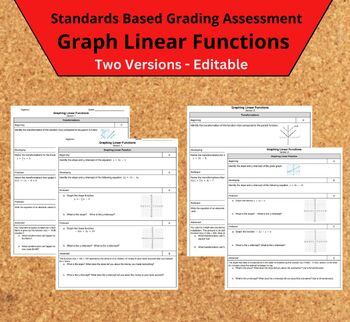
Graphing Linear Functions Standards Based Assessment - Two Versions - Editable
DeBer's Bulletin
6 Followers
Grade Levels
7th - 10th
Subjects
Resource Type
Standards
CCSSHSF-IF.B.5
CCSSHSF-IF.B.6
CCSSHSF-IF.C.7
CCSSHSF-IF.C.7a
CCSSHSF-BF.B.3
Formats Included
- Google Docs™
DeBer's Bulletin
6 Followers

Made for Google Drive™
This resource can be used by students on Google Drive or Google Classroom. To access this resource, you’ll need to allow TPT to add it to your Google Drive. See our FAQ and Privacy Policy for more information.
Description
Get your Algebra 1 test ready with Linear Inequalites Assessment! This standards-based format covers two standards related to graphing. One section is on graphing linear functions and the other is on transformations of graphs for linear and absolute value functions. Make sure you’re students are well-prepared and meeting the Algebra 1 standards with the Graphing Linear Functions assessment. Save time by purchasing this premade assessment which comes with two versions that are editable and answer key included! Use the one version as a retake and grade easily with the answer key.
Total Pages
Answer Key
N/A
Teaching Duration
N/A
Report this resource to TPT
Reported resources will be reviewed by our team. Report this resource to let us know if this resource violates TPT’s content guidelines.
Standards
to see state-specific standards (only available in the US).
CCSSHSF-IF.B.5
Relate the domain of a function to its graph and, where applicable, to the quantitative relationship it describes. For example, if the function 𝘩(𝘯) gives the number of person-hours it takes to assemble 𝘯 engines in a factory, then the positive integers would be an appropriate domain for the function.
CCSSHSF-IF.B.6
Calculate and interpret the average rate of change of a function (presented symbolically or as a table) over a specified interval. Estimate the rate of change from a graph.
CCSSHSF-IF.C.7
Graph functions expressed symbolically and show key features of the graph, by hand in simple cases and using technology for more complicated cases.
CCSSHSF-IF.C.7a
Graph linear and quadratic functions and show intercepts, maxima, and minima.
CCSSHSF-BF.B.3
Identify the effect on the graph of replacing 𝘧(𝘹) by 𝘧(𝘹) + 𝘬, 𝘬 𝘧(𝘹), 𝘧(𝘬𝘹), and 𝘧(𝘹 + 𝘬) for specific values of 𝘬 (both positive and negative); find the value of 𝘬 given the graphs. Experiment with cases and illustrate an explanation of the effects on the graph using technology.


