
Graphing Quadratic Functions Real World PBL – Desmos Activity | Algebra 1 & 2


- Zip
What educators are saying
Also included in
 Are your students struggling to grasp the concepts of quadratic functions? Look no further than this Quadratic Equations Mini-Bundle – activities for solving quadratics by factoring and graphing quadratics. Make the learning process more enjoyable while ensuring effective comprehension. Composed ofPrice $10.50Original Price $17.25Save $6.75
 This bundle is a great addition to any Algebra curriculum! Includes many algebra concepts – one-step, two-step, multi-step, and absolute value equations and inequalities, linear equations, systems of equations, exponential functions, exponents, quadratics, and more! A diverse set of resources – selfPrice $130.00Original Price $226.50Save $96.50
 This bundle is a great addition to any Algebra 2 curriculum! Includes many algebra 2 concepts – imaginary numbers, quadratic functions, piecewise functions, polynomials, radicals, exponentials, rational functions, and more! A diverse set of resources – games, projects, practice worksheets, and more!Price $75.00Original Price $121.50Save $46.50
Description
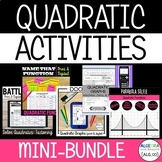
Connect math to real life in this Graphing Quadratic Functions Project. This project based learning activity is perfect for students to write a quadratic equation, graph the quadratic, and analyze characteristics of the graph. Plus, they have fun taking a selfie with a parabola in the real world!!!
Parabola Selfie Project: Students will analyze a parabola in the real world by demonstrating their knowledge and understanding of the following skills:
• Find a parabola in the real world and identify it’s dimensions
• Graph the parabola and determine the following characteristics of the function:
• Domain and Range
• Minima/Maxima
• Intervals of Increase and Decrease
• Vertex
• A point and a reflection point
• Axis of Symmetry
• Zeros
• Y-Intercept
• Write an equation (vertex form and standard form) that represents the parabola
Included:
- Student handout with instructions - 100% Editable
- A VIDEO is included on how to use Desmos for this activity
- Rubric - 100% editable
Check out the preview to see what skills are covered and more details of this fun project!!!
✅ Click HERE to SAVE over 30% on the Quadratic Equations Activities Mini-Bundle
You can find more Real World Projects here:
Real World Linear Equations Project
Systems of Linear Equations Project
Linear, Exponential, & Quadratic Regression Project
Exponential Regression Project | Cryptocurrency
Solving Absolute Value Inequalities Project
Real World Quadratic Regression Project
Math Review Project | Math Vlogger
∞∞∞∞∞∞∞∞∞∞∞∞∞∞∞∞∞∞∞∞∞∞∞∞∞∞∞∞∞∞∞∞∞∞∞∞∞∞∞∞∞∞∞∞∞∞∞
© Algebra and Beyond
This product is intended for personal use in one classroom only. For use in multiple classrooms, please purchase additional licenses.
