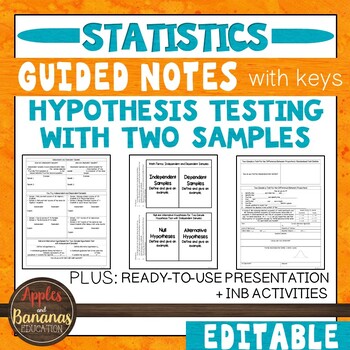
Hypothesis Testing with Two Samples - Guided Notes, Presentation, INB Activities
- Zip
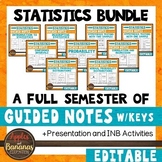
Also included in
- Price $198.77Original Price $283.95Save $85.18
- These Statistics products are flexible, editable, and can be used for in-person or distance learning. Each unit contains guided notes embedded with student practice problems (keys included), foldable activities, and a PowerPoint presentation for focused instruction. Choose what works best for your cPrice $68.00Original Price $85.25Save $17.25
Description
This Hypothesis Testing with Two Samples (Statistics) product is flexible, editable, and can be used for in-person or distance learning. It includes guided notes embedded with student practice problems (keys included), foldable activities, and a PowerPoint presentation for focused instruction. Choose what works best for your class/student and modify to make the content fit your needs. Notes are designed to clearly present the topics and reach all types of learners. Take the time and stress out of creating your own guided notes and presentations. There are many ways to use this engaging bundle.
The zip file includes BOTH editable, plain-font resources and ready-to-print, non-editable PDFs. Suggested use guides are included. These materials may be placed on an LMS for distance learning!
Interactive Math Notebook FORMAT – Includes 2 parts: guided notes and foldable activities. Piece the components together and students can create their own “math textbook” in a math journal.
- The guided notes activities contain sample teacher answer keys. Example problems are solved on the sample teacher answer keys, but you can have your students use them over and over again with problems from your own curriculum. We have also added "You Try" activities in order to allow students to complete independent practice in between note-taking activities.
- The interactive notebook foldable activities include descriptions for use. We have not included specific examples for the interactive notebook activities. We like to give them to students for review so that they can show what they have learned and personalize their notes.
Presentation – This product contains a plain-font, no frills, PowerPoint presentation that you can use to present content to students whether you are in-person or remote. Modify the editable presentation to best fit your needs.
This bundle also contains a description of how to use the materials included and the suggested groupings for presenting the notes and interactive notebook activities with your students.
This product is perfect to use with any textbook or e-book curriculum and great for engaging all types of learners, including those with special needs.
Guided Note Sheets with Sample Teacher Keys are included for the following:
- Independent and Dependent Samples
- Independent or Dependent?
- Null and Alternative Hypotheses for Two-Sample Hypothesis Test with Independent Samples
- Conditions Necessary to Perform a z-Test for the Difference Between Means
- Finding the Standardized Test Statistic and the Standard Error
- Two-Sample z-Tests for the Difference Between Means
- Conditions Necessary to Perform a Two-Sample t-Test for the Difference Between Means
- Finding the Standardized Test Statistic and the Standard Error
- Two-Sample t-Test for the Difference Between Means (Variances NOT Equal)
- Two-Sample t-Test for the Difference Between Means (Variances Equal)
- Conditions Necessary to Perform a Two-Sample Hypothesis Test with Dependent Samples
- Finding d, sd, and the Standard Test Statistic
- Using the t-Test for the Difference Between Means (Dependent Samples)
- Conditions Necessary to Perform z-Test for the Difference Between Proportions
- Sampling Distributions for the Difference Between Sample Proportions
- Two-Sample z-Test for the Difference Between Proportions: Standardized Test Statistic
- Two-Sample z-Test for the Difference Between Proportions
Plus corresponding Interactive Math Notebook Foldable Activities and Presentation.
Related Products:
**Full-year Curriculum Packs**
Algebra 1, Geometry, Algebra 2 Curriculum Pack MEGA BUNDLE
Algebra 1 Curriculum Pack BUNDLE
Geometry Curriculum Pack BUNDLE
Algebra 2 Curriculum Pack BUNDLE
Scaffolded Notes/Interactive Notebook Bundles
Algebra 1 INB Bundle
Geometry INB Bundle
Algebra 2 INB Bundle
Pre-Calculus INB Bundle
Pre-Calculus Add on for Algebra 2 INB Bundle
Statistics INB Bundle
High School Math Interactive Notebook Bundle (Algebra 1, Geometry, Algebra 2)
Student Practice Pages Bundles
Algebra 1 Student Practice Pages Bundle
Geometry Student Practice Pages Bundle
Algebra 2 Student Practice Pages Bundle
High School Math Student Practice Pages Bundle (Algebra 1, Geometry, Algebra 2)
Assessment Bundles
Algebra 1 Assessment Bundle
Geometry Assessment Bundle
Algebra 2 Assessment Bundle
High School Math Assessment Bundle (Algebra 1, Geometry, Algebra 2)
**If you like what you see, please click on the "Follow Me" star to learn about new products, sales, and more!


