
Linear Graphs Algebra Scaffolded Guided Notes Practice Worksheets Exit Tickets


- Zip
Products in this Bundle (7)
showing 1-5 of 7 products
Bonus
Also included in
 Get a full year's worth of Algebra 1 Guided Notes that are ready to print and full of CCLS aligned content that has been scaffolded for students. The following essential algebra topics are included in this bundle: Middle School Math Review, Equations and Inequalities, Functions, Linear Graphs, LineaPrice $135.00Original Price $162.00Save $27.00
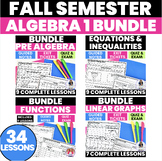 This Fall Semester Algebra 1 Guided Notes Bundle is aligned to Algebra 1 Math Common Core Learning Standards and including a total of 4 Units of Scaffolded Lessons. The following units are included in this ready to print bundle: Middle School Math Review, Equations and Inequalities, Functions, and GPrice $89.99Original Price $99.00Save $9.01
Description
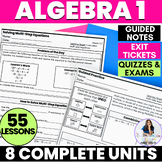
This complete, ready-to-print Algebra 1 Bundle includes 7 Lessons with scaffolded Guided Notes focused on Linear Graphs including slope, rewriting equations from standard to slope-intercept form and graphing equations and inequalities. Each lesson includes class notes with Vocabulary, a guided practice page along with Independent Practice and Exit Tickets. This Bundle also includes a Student Pacing Page for Notebooks and Binders, along with a Mid Unit Quiz and Post Unit Exam that has multiple choice questions and open response questions.
➡️ Please view the PREVIEW to see this bundle more in-depth
➡️ MAKE SURE TO DOWNLOAD BONUS FILE: Includes all unit assessments, student pacings for notebooks and all guided notes in the unit and answer keys on 1 downloadable file to make it easier for your purchase
➡️ TOPICS INCLUDED IN THIS BUNDLE
- 4.1: Identifying Slope from a Table
- 4.2: Finding Intercepts on a Graph
- 4.3: Determining if a Point is a Solution
- 4.4: Finding Slope from 2 Points
- 4.5: Rewriting from Standard form to Slope-Intercept Form
- 4.6: Graphing Linear Equations on Coordinate Plane
- 4.7: Graphing Inequalities on Coordinate Plane
➡️ WHAT'S INCLUDED IN THIS BUNDLE
- 7 Lessons with Guided Notes, Practice and Exit Ticket
- Mid Unit Quiz
- Post Unit Exam
- Answer Keys
________________________________________________________________
➡️ LET’S CONNECT
Follow me on Instagram to be the first to hear about new products and FREEBIES @algebramadesimple
________________________ VERY IMPORTANT________________________
Receive TpT Store Credits
- You can receive TPT store credits to use on future purchases by leaving feedback on any products you buy! Click on "My Purchases" to access the feedback link. I really appreciate your support, please leave feedback on my products. Your feedback will ensure I make the very best products for you and your students!
