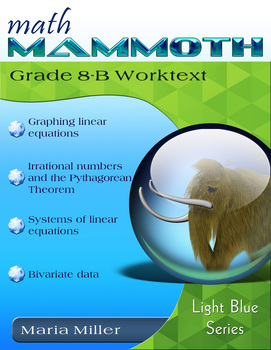
Math Mammoth Grade 8-B Curriculum
- Zip
Description
Math Mammoth Grade 8-B is a complete math curriculum for the latter half of 8th grade mathematics studies, based on the Common Core Standards for 8th grade (CCS)).
At the heart of the curriculum is the student worktext. The worktext contains all the instruction and the exercises in the same book — which makes lesson preparation a breeze. The worktext is written directly to the student, and thus allows many students to teach themselves and to learn directly from the text.
You will also get a separate answer key, chapter tests, end-of-year test, additional cumulative reviews, and a versatile worksheet maker (Internet access required) for those times when your student needs a bit more practice.
Features
- Math Mammoth focuses on conceptual understanding. It explains the "WHY", so students can understand the math, not just learn "HOW" to do it.
- The curriculum is mastery-oriented. This means it concentrates fairly long on a topic, delving into its various aspects. This promotes conceptual understanding, as opposed to spiral curricula that often tend to jump from topic to topic too much.
- It requires very little teacher preparation.
- The curriculum has no separate teacher's manual nor is it scripted. The introduction to each chapter has some notes for the teacher concerning the material in the chapter. All the instruction is written directly to the student in the worktext.
- After each chapter introduction, you will find a list of Internet links and resources (games, quizzes, illustrations, etc.) that can be used for fun, illustrations, and further practice.
Overview of topics
The main areas of study are:
- graphing linear equations and proportional relationships
- irrational numbers, square and cube roots, and the Pythagorean Theorem
- solving systems of linear equations (in two variables)
- statistics: scatter plots and two-way tables
Please also see the table of contents (in the sample file), which will let you see the topics covered in more detail.
Introduction
In part 8-B, students graph linear equations, learn about irrational numbers and the Pythagorean Theorem, solve systems of linear equations, and investigate patterns of association in bivariate data (scatter plots).
Chapter 5 deals with the topic of graphing linear equations. Students study slope, and graph and write linear equations in slope-intercept and standard forms. They also learn about parallel and perpendicular lines.
In chapter 6, we delve into square roots, cube roots, irrational numbers, and equations involving square and cube roots. The rest of the chapter is spent studying the Pythagorean Theorem and its applications.
Next, in chapter 7, we focus on systems of linear equations. Students learn the three basic techniques for solving these and also solve a variety of problems that lead to a pair of linear equations.
The last chapter has to do with an introduction to bivariate data in statistics: scatter plots and two-way tables.
--------------------------------------------
The PDF files in this product can be filled in using a computer or a tablet (distance learning).
The student will need to use either Adobe Reader (on desktop/laptop) or a PDF app that has annotation tools (phones or tablets). Several PDF apps with annotation capabilities exist; see more details here.
--------------------------------------------
It is recommended that you not share the entire student worktext PDF files with students. Instead, it is better to just give the students a few pages at a time. Here is a simple method for extracting a few pages from a PDF file. It is done using Google Chrome.
1. Open the PDF file in Chrome.
2. Go to "Print" (Ctrl+P).
3. Print to PDF, and choose the page range.
4. Click the "Save" button.


