Probability Project - Design Your Own Amusement Park
- PDF
What educators are saying
Description
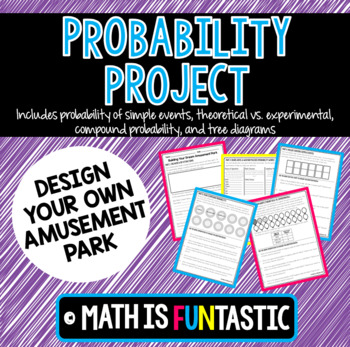
This project is designed to be a cumulative activity for students to complete after a probability unit. Skills in this unit include probability of simple events, theoretical vs. experimental probability, probability of compound events, and tree diagrams. This project can be given over the course of a couple of days or you can split each task up into a separate day. In this project, students will complete different tasks that relate to designing their own amusement park. The project is spit into six different sections that are outlined below:
1) The Name & Top Attractions – The first part of this activity is used to create student buy in. Students will come up with the name of their amusement park and describe three of the top attractions at the park.
2) Hours, Dates, & Weather Policies – Students will come up with their park hours, select dates that the park will be closed, and describe the general weather policies. Using the information that they have come up with, they will then have to identify simple events as never, unlikely, equally likely, likely, or certainly going to happen.
3) Roller Coaster – Students will color the seats of their most popular roller coaster. They will need to choose from green, red, or blue. Then, using their colored seats, they will answer questions related to the probability of simple events.
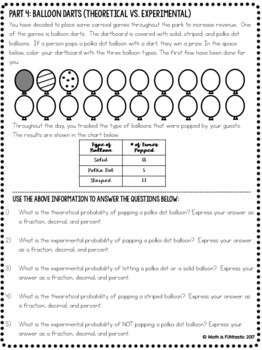
4) Balloon Darts – Students will decorate balloons as solid, striped, or polka dot for their theme park. They will then answer questions related to theoretical vs. experimental probability based on their drawings.
5) Food – Students will label ten plates with their three most popular desserts (cookies, cheesecake, and apple pie). They will then answer questions related to compound probability.
6) Gift Shop – Students will create a tree diagram related to their park’s mascot. They will then answer probability questions using their possible outcomes.
In order to make this project more appealing to students, each page has information that the student MUST complete about their own amusement park. As a result, no two students’ work will be the same. It is for this reason that there is no answer key to this particular product.
Looking for more real-life math ideas? Check out the proudcts below:
• Holiday Shopping: Sales Tax and Discounts
• Proportional Relationships Project - Planning Your Dream Party
• Operations with Rational Numbers - Road Trip Application
• Parallel Lines Cut by a Transversal - Create a Town Project
• Percent Project Design Your Own Taco Truck
• Real-Life Area of Composite Figures
• Real-Life Surface Area & Volume
• Volume of Cylinders, Cones, & Spheres - Real Life Activity
Need more probability products? Check out these other great deals!
• Compound Probability Bundle
• Compound Probability Lesson Plan
• Compound Probability Mazes
• Compound Probability Puzzle
• Probability of Simple Events Quick Color
Be the first to know about the newest products and promotions. Follow Math is FUNtastic by clicking the green star above!
©️Math is FUNtastic 2018
This purchase is for one teacher only. Additional licenses are available at a discounted price.


