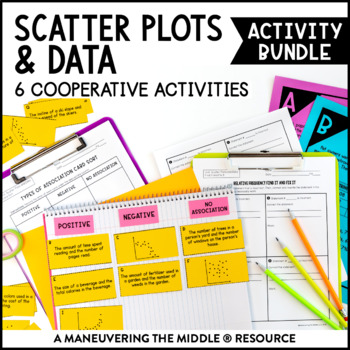
Scatter Plots and Data Activity Bundle | Trend Lines Activities for 8th Grade
- Zip
What educators are saying
Products in this Bundle (6)
showing 1-5 of 6 products
Description
This Scatter Plots and Data Activity Bundle includes 6 classroom activities to support 8th grade scatter plots and two-way tables.
These hands-on and engaging activities are all easy to prep! Students are able to practice and apply concepts with these scatter plots and two-way table activities, while collaborating and having fun! Math can be fun and interactive!
Standards: CCSS (8.SP.1, 8.SP.2, 8.SP.3, 8.SP.4) and TEKS (8.5C, 8.5D, 8.11A)
More details on what is included:
Six hands-on activities that can be utilized in pairs or groups of 3-4. All activities include any necessary recording sheets and answer keys.
- Card Sort: scatter plots and association
- Investigation Activity: constructing scatter plots
- Cut and Paste: scatter plots and trend lines
- Scavenger Hunt: trend lines and predictions
- Guess My Table: two-way tables
- Find It, Fix It: relative frequency
***Please download a preview to see sample pages and more information.***
How to use this resource:
- Use as a whole group classroom activity
- Use in a small group for additional remediation, tutoring, or enrichment
- Use as an alternative homework or independent practice assignment
- Incorporate within our Scatter Plots and Data Unit to support the mastery of concepts and skills.
Time to Complete:
- Most activities can be utilized within one class period. Performance tasks summarize the entire unit and may need 2-3 class periods. However, feel free to review the activities and select specific problems to meet your students’ needs and time specifications. There are multiple problems to practice the same concepts, so you can adjust as needed.
Looking for instructional materials?
- Check out the corresponding Scatter Plots and Data Unit, which includes student handouts, independent practice, assessments, and answer keys.
More 8th Grade Activity Bundles:
Unit 2: Exponents and Scientific Notation
Unit 10: Volume
Unit 11: Scatter Plots and Data
More 8th Grade Units:
Unit 2: Exponents and Scientific Notation
Unit 10: Volume
Unit 11: Scatter Plots and Data
Looking for more helpful teaching tips, ideas, and support? Check out Maneuveringthemiddle.com and join our online FB community MTM VIPS!
Try out a FREE math resource! Grab your freebie here!
Licensing:
This file is a license for ONE teacher and their students. Please purchase the appropriate number of licenses if you plan to use this resource with your team. Thank you!
Customer Service:
If you have any questions, please feel free to reach out for assistance. We aim to provide quality resources to help teachers and students alike, so contact me before leaving feedback if you have a need.
Maneuvering the Middle® Terms of Use
Products by Maneuvering the Middle®, LLC may be used by the purchaser for their classroom use only. This is a single classroom license only. All rights reserved. Resources may only be posted online in an LMS such as Google Classroom, Canvas, or Schoology. Students should be the only ones able to access the resources. It is a copyright violation to upload the files to school/district servers or shared Google Drives. See more information on our terms of use here.
If you are interested in a personalized quote for campus and district licenses, please click here.
©Maneuvering the Middle® LLC, 2012-present


