Scatterplots Linear Regression Line of Best Fit Forearms & Height (Editable)
Peter Jonnard
369 Followers
Grade Levels
7th - 12th
Subjects
Resource Type
Formats Included
- Word Document File
Pages
3 pages
Peter Jonnard
369 Followers
Description
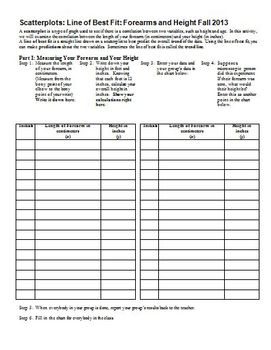
After teaching my students about scatterplots, correlation, and the line of best fit, I take a day for them to do a hands-on lab, in which they measure their height (in inches) and their forearm length (from the tip of their elbow, to the bony point on their wrist), and we plot the class data, write the equation of the line of best fit, and then use the equation generated both forwards and backwards. They will need 45 minutes to an hour to do this in class.
I have found that if the students bring me their data and I enter it on a projector in front of the class, where I can use a different color for each group, they have an easier time graphing the data.
If you are fortunate to have a high-speed printer nearby, you can print one copy per table of the class data and avoid the step of having them copy the class data by hand.
You may also be able to post the class data on a school website, as I do, and then students can pull it up on their smartphones, which cuts out the need for additional copies. This is one time I allow and encourage use of the smartphone in class!
Some years, the data have very little correlation, so I have the students include a point for "microscopic man" at (0, 0). One of the most challenging aspects of this activity is that students base their calculation of the slope on the squares on the page, instead of taking into account that each vertical unit counts for a different amount from each horizontal unit.
When you print out the pages, you will see that part 3 comes in the middle. The reason for doing it this way is that if you make photocopies back-to-back, the graph will be on a separate sheet of paper from the data and follow-up questions, and it is much more efficient for the students to be able to use the graph without flipping the page back and forth. But I do think you should point this out to your students so they know why you did it that way.
The preview file is a pdf so you may see exactly what's included; the product file is a word document, which you may want to edit for your students. (For instance, I have my name, Mr. Jonnard, on it, and you may wish to change it to a more familiar person).
Immediately before this worksheet, I use the worksheet named 'Direct Variation Functions Fall 2013' (http://www.teacherspayteachers.com/Product/Direct-Variation-Functions-Fall-2013-1106044), and immediately after this worksheet, I use the resource named 'Final Exam Study Guide Accelerated Algebra 1 Fall 2013' (http://www.teacherspayteachers.com/Product/Final-Exam-Study-Guide-Accelerated-Algebra-1-Fall-2013-1106636)
Keywords: scatterplot, line of best fit, forearms, height, lab, Jonnard
Total Pages
3 pages
Answer Key
Not Included
Teaching Duration
1 hour
Report this resource to TPT
Reported resources will be reviewed by our team. Report this resource to let us know if this resource violates TPT’s content guidelines.


