TPT
Total:
$0.00

Slope Activity Bundle: Graph Slope; Slope-Intercept form; Write Linear Equations

Rated 4.92 out of 5, based on 36 reviews
4.9 (36 ratings)
;
Ready-Made Resources
1.1k Followers
Grade Levels
8th - 10th
Subjects
Resource Type
Standards
Formats Included
  • Zip
$8.00
List Price:
$10.00
You Save:
$2.00
Bundle
$8.00
List Price:
$10.00
You Save:
$2.00
Bundle
Share this resource
Report this resource to TPT
Ready-Made Resources
1.1k Followers

What educators are saying

This bundle likely offers a variety of engaging activities that cater to different learning styles and proficiency levels. Students can expect hands-on practice graphing slopes, mastering the slope-intercept form, and honing their skills in crafting linear equations
What a fun bundle of activities. My students really enjoyed solving the mystery for each one. The mysteries are well-done and cover the topic nicely. What a fun way for students to practice their skills.

Products in this Bundle (3)

    Description

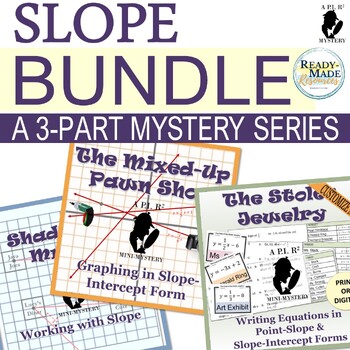
    Unleash Your Inner Detective: Solve mysteries with slope equations in these engaging activities! In this bundle they’ll GRAPH and WRITE equations in slope-intercept and point-slope forms!

    ACTIVITY ONE: Shadowing Mr. M

    Expert detective, Ray Radicand, is shadowing Mr. M. for the day. We know that Mr. M. started at his home. From there, students will use the clues Ray left in the form of linear equations to determine the places Mr. M. travelled.

    Students will identify the slope in the equation, and then count out that slope using rise over run on the grid and draw a line segment to discover each of Mr. M.’s stops.

    When they have completed all 15 equations, students will have a list of all the places Mr. M. visited while we was being shadowed.

    ACTIVITY TWO: The Case of the Mixed Up Pawn Shop

    Expert detective, Ray Radicand, followed his suspect, Mr. M. and saw him enter a pawn shop. Unfortunately the unorganized employee lost track of what each person pawned.

    Students will graph each linear equation which will connect each person to the item they pawned. Through the process of elimination, students will determine the item that Mr. M. brought in.

    ACTIVITY THREE: The Stolen Jewelry (Scavenger Hunt)

    This activity combines the skill of writing linear equations when given either two points or a point and a slope with the classic board game CLUE. Students will use the clues they gather from correctly solving equations to solve the mystery of The Stolen Jewelry.

    Terms of Use

    All content in this product is the copyrighted property of Ready-Made Resources. You are granted permission to use this product for your personal and non-commercial use. You may not sell, trade, share or redistribute this product in any form. You may not create a derivative work and claim it as your own. If you have any questions regarding terms of use, contact info@rmr4edu.com

    Total Pages
    Answer Key
    Included
    Teaching Duration
    N/A
    Report this resource to TPT
    Reported resources will be reviewed by our team. Report this resource to let us know if this resource violates TPT’s content guidelines.

    Standards

    to see state-specific standards (only available in the US).
    Graph proportional relationships, interpreting the unit rate as the slope of the graph. Compare two different proportional relationships represented in different ways. For example, compare a distance-time graph to a distance-time equation to determine which of two moving objects has greater speed.
    Understand that a function is a rule that assigns to each input exactly one output. The graph of a function is the set of ordered pairs consisting of an input and the corresponding output.
    Interpret the equation 𝘺 = 𝘮𝘹 + 𝘣 as defining a linear function, whose graph is a straight line; give examples of functions that are not linear. For example, the function 𝘈 = 𝑠² giving the area of a square as a function of its side length is not linear because its graph contains the points (1,1), (2,4) and (3,9), which are not on a straight line.
    Construct a function to model a linear relationship between two quantities. Determine the rate of change and initial value of the function from a description of a relationship or from two (𝘹, 𝘺) values, including reading these from a table or from a graph. Interpret the rate of change and initial value of a linear function in terms of the situation it models, and in terms of its graph or a table of values.
    Create equations in two or more variables to represent relationships between quantities; graph equations on coordinate axes with labels and scales.

    Reviews

    Questions & Answers

    1.1k Followers