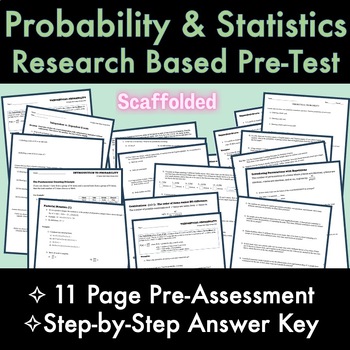
Statistics & Probability RESEARCH BASED 11-Page PreTest/PreAssessment with Key
- Zip
Also included in
- 87 qualified high school math teachers have been surveyed POST-COVID across the 6 subjects (algebra 1, algebra 2, geometry, precalculus, calculus, and statistics & probability). They are all a compilation of their answers to the question: what do you WISH students knew BEFORE taking the course?Price $18.60Original Price $23.25Save $4.65
Description
87 qualified high school math teachers have been surveyed POST-COVID across the 6 subjects (algebra 1, algebra 2, geometry, precalculus, calculus, and statistics & probability). This 11-page research-based scaffolded statistics & probability pretest/ pre-assessment/ common assessment is a compilation of their answers to the question: what do you WISH students knew BEFORE taking the course? The assessment is scaffolded for students as well!
---------------------------
Check out my other research-based pre-assessments!
➤ Algebra 1 - 9 Pages with Key
➤ Algebra 2 [FREE Link Download Inside This Pretest!!] - 10 Pages with Key
➤ Geometry - 10 Pages with Key
➤ Precalculus - 9 Pages with Key
➤ Calculus - 9 Pages with Key
---------------------------
Prerequisite Stats & Probability List of Topics (step-by-step key provided):
✫ Basic Algebra
- Order of operations
- Converting between fractions, decimals and percents (to in the future calculate and interpret probabilities, calculate margin of error and confidence intervals, interpret confidence levels and Type 1 and Type 2 error probabilities)
- Rounding to the nearest whole, tenth, hundredth, thousandth (to in the future calculate numerical summary statistics, test statistics, and confidence intervals)
- Operations of fractions
- Given a real-world linear equation, students identify the slope and y-intercept, and then explain what they mean in the context of the problem
- Plotting points and intervals on a number line (to in the future make and interpret dotplots)
- Find the distance between two points on a number line (to in the future calculate deviations from the mean)
- Evaluating an algebraic expression (to in the future calculate numerical summary statistics, test statistics, confidence intervals, z-scores and regression coefficients)
- Solving a linear equation (to in the future find percentiles for a normal distribution)
- Solving a rational equation (to in the future find z-scores)
✫ Probability Foundation:
- Define a factorial
- Simplify factorials
- Fundamental Counting Principle
- Permutation & Combination
- Basic probability problems (pulling out a blue marble from a bag, etc.)
- Complement of a set (to in the future define events and calculate their probabilities)
- How many total cards in a deck? How many suits? How many red? Black? etc.
- How many traditional sides does a die have? How many digits or letters in the alphabet are there? How many vowels? etc.
- Given a tree diagram, students use it to write out a sample space in set notation
- Find the intersection and union of a set (to in the future define events and calculate their probabilities)
- Venn diagram problem (to in the future understand probability rules and calculations)
- Matching real events with probabilities of them occurring from a 2023 study (chances of winning the lottery, getting struck by lightening, dating a supermodel, winning the Oscars, etc)
✫ Statistics Foundation:
- Find the sum of numbers
- Find the mean, median, mode, range of a set
- Interpreting and analyzing a pie chart & histogram (to in the future interpret graphical displays of data)
- Students complete a series of steps in a scaffolded way by also filling out the blanks in a chart. Ultimately, students are guided to find the standard deviation of a small data set with 5 elements
- Fill out a frequency table
- Students answer simple questions about finding the area under a curve (to in the future approximate probabilities for the bell curve using z-scores, P-values and understand graphical displays of data)


