Test 3| 2021 SP_MSDS_401-DL_SEC58 Applied Statistics with R
- PDF
Description
Test 3| 2021 SP_MSDS_401-DL_SEC58 Applied Statistics with R
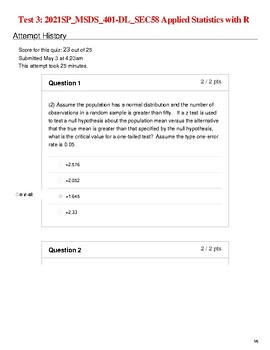
(2) Assume the population has a normal distribution and the number of observations in a random sample is greater than fifty. If a z test is used to test a null hypothesis about the population mean versus the alternative that the true mean is greater than that specified by the null hypothesis, what is the critical value for a one-tailed test? Assume the type one-error rate is 0.05.
FalseTrue(1) Answer True or FalseAssume a random sample of size n is from a normal population. Assume a single sample t test is used to for hypothesis testing. The null hypothesis is that the population mean is zero versus the alternative hypothesis that it is not zero. If the sample size is decreased, and the Type I error rate is unchanged, then the Type II error rate will increase.
(4) Use the given data to find the sample size required to estimate the population proportion.Margin of error: 0.011; confidence level: 98%; p and q unknown
In 1923, Babe Ruth had 522 at bats with 205 hits. Assuming that the binomial distribution can be appropriately applied, find the expected number of hits in 529 at bats.
The t-statistic distribution is based upon the assumption of a random sample from a normal population.If the sample size is increased and the same test statistic and alpha level are used, the power of the test will increase.The sampling distribution of a statistic is the probability distribution for that statistic based on all possible random samples from a population.A symmetric, heavy-tailed distribution cannot be detected using a boxplot and QQ chart.(5) Multiple ChoiceWhich of the following statements is not true?
30 kg25 kg58 kg158 kgA sample of 40 cows is drawn to estimate the mean weight of a large herd of cattle. If thestandard deviation of the sample is 96 kg, what is the maximum error in a 90%confidence interval estimate?
66.2 in < µ < 66.8 in.65.9 in < µ < 67.1 in.65.6 in < µ < 67.4 in.65.7 in < µ < 67.3 in.(8) Solve the problem.A 99% confidence interval (in inches) for the mean height of a population is 65.7 < µ < 67.3. This result is based on a sample of size 144. Construct the 95% confidence interval. (Hint: you will first need to find the sample mean and sample standard deviation).
0.425 < p < 0.6470.426 < p < 0.6460.408 < p < 0.6690.392 < p < 0.641(3) Use the degree of confidence and sample data to construct a confidence interval for the population proportion p.n = 62, x = 32; 95% confidence (Use the procedure in Business Statistics Section 8.3.)
2678511311068If you wanted to estimate the true percentage of all voters in Canada who are in favor ofabolition of the senate, and if you wanted your maximum error of estimate to be 6% witha confidence level of 95%, what would the required sample size be?
1.331 21.4Suppose the respective probabilities are 0.7, 0.2, and 0.1 that a person applying for a driver’slicense in Saskatchewan will require 1, 2, or 3 attempts in order to obtain a license. Let Xbe a random variable, the number of attempts in order to obtain a license. Find the mean (expected value) of X.


