5 results
Common Core 8.SP.A.2 resources on sale
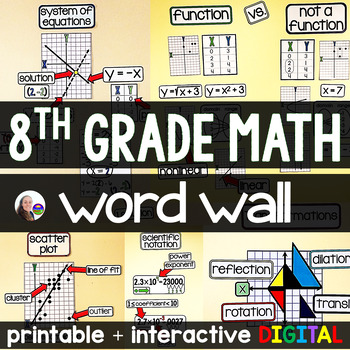
8th Grade Math Word Wall | 8th Grade Math Classroom Vocabulary
This 8th grade math word wall shows vocabulary and concepts in action and in the context of related words. The visuals can be added to your math bulletin board all at once or throughout the school year to support student learning.With references for scatter plots, correlation, function vs not a function, combining like terms, one/zero/infinite solutions when solving equations, exponent rules, transformations, triangle sums, Pythagorean Theorem, systems of equations, squares, cubes, D=RT, rationa
Subjects:
Grades:
8th
Also included in: All Math Word Walls Bundle | Math Bulletin Board Vocabulary Grades 2-11
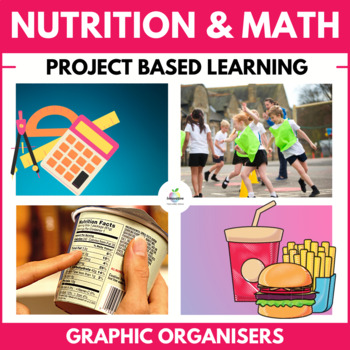
Food & Nutrition Labels | Healthy Eating Math Unit | Statistics & Data | PBL
Teach your students the importance of HEALTHY EATING with this engaging NUTRITION LABEL reading unit. Students will learn to evaluate nutrition labels and make informed choices about DIET and the foods they consume.This NO-PREP, MULTIDISCIPLINARY MATH UNIT will keep them engaged as they learn about FAST FOOD, what they are putting in their mouth, and the amount of activity required to burn it off. AN ESSENTIAL LIFE SKILL.Most students love ♨️FAST FOOD♨️; maybe it's a guilty pleasure, but do we
Subjects:
Grades:
4th - 9th
Also included in: Innovative Substitute Teaching Bundle | No Prep Sub Plans
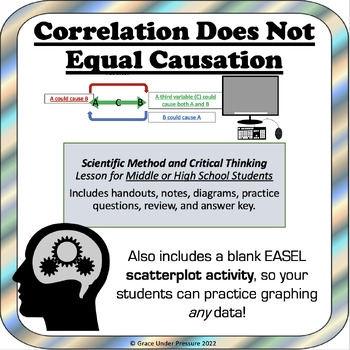
Correlation Does Not Equal Causation: Scientific Method & Critical Thinking
Scientific Method and Critical Thinking Lesson for Middle or High School Students: This printable booklet teaches students about correlation, scatterplots, correlation coefficients, third variables, true experiments, independent and dependent variables, random assignment and more in an easy-to-understand and engaging manner.12 different correlation examples are included. The package includes handouts, notes, diagrams, practice questions, a review, and an answer key.I have also included my blank
Subjects:
Grades:
8th - 12th
Types:
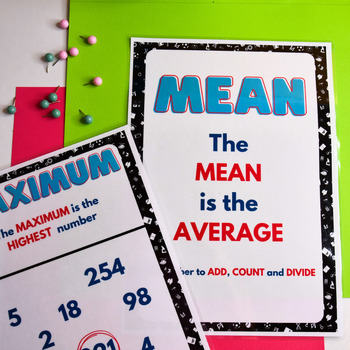
Mean, Median, Mode & Range Classroom Posters Set | Math, Statistics, Data
These measures of central tendency posters are perfect for teaching mean, median, mode and range in your classroom when exploring statistics and data in math.Our beautifully designed posters provide clear and concise explanations of each concept and colorful examples that will capture your students' attention and keep them engaged. With these posters in your classroom, your students will be constantly reminded of these essential statistical concepts and easily apply them to real-world problems.
Subjects:
Grades:
5th - 8th
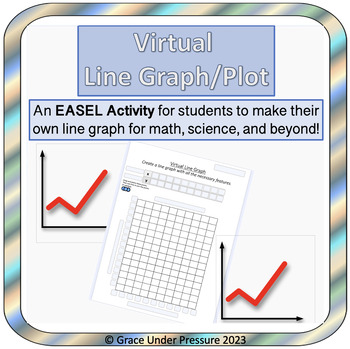
Virtual Line Graph or Scatter Plot Template: EASEL ONLY
This product is a virtual (EASEL) line graph or scatter plot template that can be used for graphing data from math, science, social studies, psychology, or other subjects.You can type in the ordered pairs ahead of time, or you can have your students type them into the (x,y) chart. Then, they have to use the ordered pairs to make a line graph or scatter plot:• Type in a title• Label x & y axis• Choose an appropriate scale and enter it on each axis• Drag and drop the circles as data points• Us
Subjects:
Grades:
Not Grade Specific
Showing 1-5 of 5 results

