13 results
Common Core 8.SP.A.1 interactive whiteboards
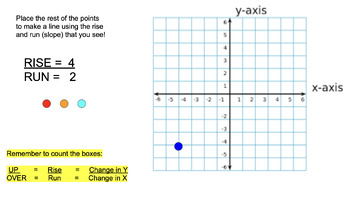
Coordinate Plane, Slope, Rise/Run, Graphing - Online No Prep Bundle
A bundle of activities which can be used as formal lessons or independent practice. Great for Google Classroom or Smart-boards! Also can be used as sub plans! Created by a Special Education Math Teacher to help students become comfortable with graphing!
Grades:
5th - 12th
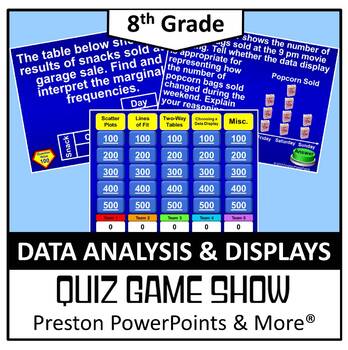
(8th) Quiz Show Game Data Analysis and Displays in a PowerPoint Presentation
8th Grade Math (Pre-Algebra) Quiz Show Game Data Analysis and Displays in a PowerPoint PresentationThis Quiz Show game, Jeopardy Style, is a great way to review a chapter. There are 25 questions and a scoreboard so you don’t have to write the score on a side board. Each page has the point value!This Quiz Show game covers all of the following:Scatter Plots 8.SP.1Lines of Fit 8.SP.1, 8.SP.2, 8.SP.3Two-Way Tables 8.SP.4Choosing a Data Display 8.SP.1This Review lesson applies to the Common Core Sta
Subjects:
Grades:
7th - 9th
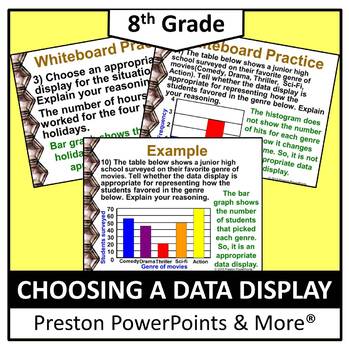
(8th) Choosing a Data Display in a PowerPoint Presentation
8th Grade Math (Pre-Algebra) Choosing a Data Display in a PowerPoint PresentationThis slideshow lesson is very animated with a flow-through technique. I developed the lesson for my 8th grade class, but it can also be used for upper level class reviews. This lesson teaches how to choose appropriate data displays and identify and analyze misleading data displays.This lesson has SKELETON NOTES, notes that have the problem only. I used this with our 1-1 district devices. This will allow for the st
Subjects:
Grades:
7th - 9th
CCSS:
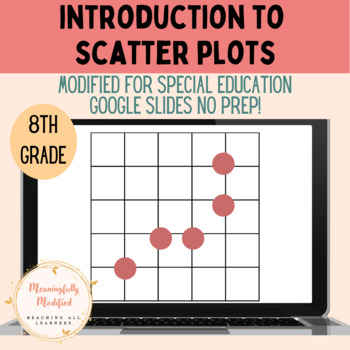
Introduction to Scatter Plots - Modified for Special Education
**Modified for Special Education**10 Google Slides with interactive activitiesIntroduces scatter plots with key vocabulary Provides practice plotting dataAligned with 8th grade CCSSGoogle Slides - No prep needed!Answer key included
Subjects:
Grades:
5th - 10th
Also included in: Modified for Special Education - Scatter Plot (Mini Bundle)
(Alg 1) Data Analysis and Displays {Bundle} in a PowerPoint Presentation
Algebra 1 Data Analysis and Displays {Bundle} in a PowerPoint PresentationThis is a bundle include the eight PowerPoint lessons below and two Quiz Show games, Jeopardy Style, for review.Measures of Central Tendency S.ID.2, S.ID.3Measures of Dispersion (Standard Deviation) S.ID.2, S.ID.3Box-and-Whisker Plots S.ID.1, S.ID.2, S.ID.3Shapes of Distributions S.ID.2, S.ID.3Quiz Show Game Central Tendencies and Dispersion S.ID.1, S.ID.2, S.ID.3Scatter Plots and Lines of Fit 8.SP.1, S.ID.6a, S.ID.6c, S
Grades:
8th - 10th
CCSS:
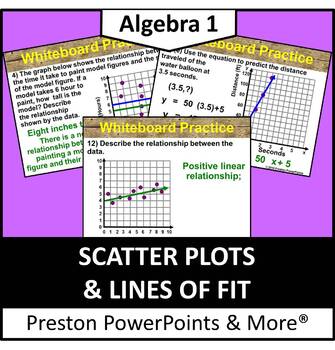
(Alg 1) Scatter Plots and Lines of Fit in a PowerPoint Presentation
Algebra 1 Scatter Plots and Lines of Fit in a PowerPoint PresentationThis slideshow lesson is very animated with a flow-through technique. I developed the lesson for my Algebra 1 class, but it can also be used for upper level class reviews. This lesson teaches how to interpret scatter plots, identify relationships formscatter plots, find lines of fit, and in real-life situations make predictions such as about ski equipment or snowmobiles.This lesson has SKELETON NOTES, notes that have the prob
Grades:
5th - 9th
CCSS:
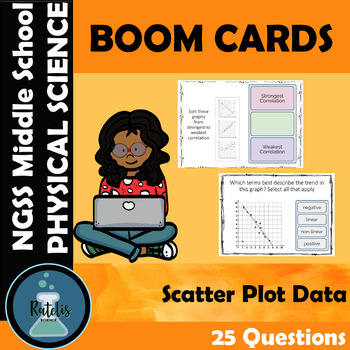
Scatter Plots and Data Analysis NGSS Boom Cards Digital Task Cards
This set of digital task cards covers trends in scatterplots for NGSS data analysis science skills.Topics in deck:Using scatterplot graphs, identify the following data trends: outlier, cluster, linear, non-linear, negative correlation, positive correlation, no correlation, cluster, strong correlation, and weak correlation.This Comprehensive Boom Card Deck contains more than 20 questions. This means that students will have to complete multiple Boom Card Play sessions to see all the review questi
Subjects:
Grades:
6th - 8th
CCSS:
(8th) Data Analysis and Displays {Bundle} in a PowerPoint Presentation
8th Grade Math (Pre-Algebra) Data Analysis and Displays {Bundle} in a PowerPoint PresentationThis is a bundle include the four PowerPoint lessons below and a Quiz Show game, Jeopardy Style, for review.Scatter Plots 8.SP.1Lines of Fit 8.SP.1, 8.SP.2, 8.SP.3Two-Way Tables 8.SP.4Choosing a Data Display 8.SP.1Quiz Show Game Data Analysis and Displays 8.SP.1, 8.SP.2, 8.SP.3, 8.SP.4These lessons have SKELETON NOTES, notes that have the problem only. I used this with our 1-1 district devices. This wil
Subjects:
Grades:
7th - 9th
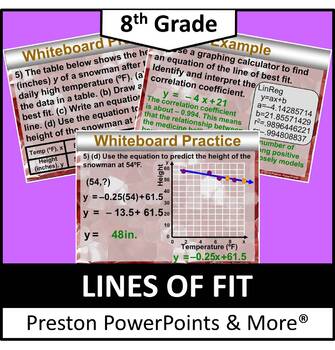
(8th) Lines of Fit in a PowerPoint Presentation
8th Grade Math (Pre-Algebra) Lines of Fit in a PowerPoint PresentationThis slideshow lesson is very animated with a flow-through technique. I developed the lesson for my 8th grade class, but it can also be used for upper level class reviews. This lesson teaches how to find lines of fit, use lines of fit to solve problems, use linear regression with a graphing calculator to find the correlation coefficient, and in real-life situations make predictions such as about ski equipment or snowmobiles.
Grades:
7th - 9th
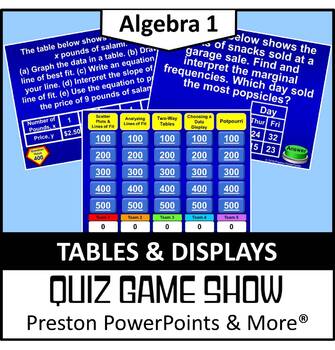
(Alg 1) Quiz Show Game Tables and Displays in a PowerPoint Presentation
Algebra 1 Quiz Show Game Tables and Displays in a PowerPoint PresentationThis Quiz Show game, Jeopardy Style, is a great way to review a chapter. There are 25 questions and a scoreboard so you don’t have to write it on a side board. Each page has the point value!This Quiz Show game covers all of the following:Scatter Plots and Lines of Fit 8.SP.1, S.ID.6a, S.ID.6c, S.ID.7Analyzing Lines of Fit S.ID.6b, S.ID.7, S.ID.8, S.ID.9Two-Way Tables 8.SP.4, S.ID.5Choosing a Data Display S.ID.1NEW: The les
Grades:
8th - 10th
CCSS:
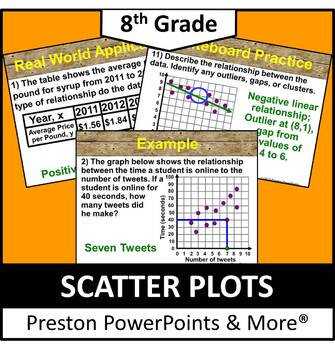
(8th) Scatter Plots of a Line in a PowerPoint Presentation
8th Grade Math (Pre-Algebra) Scatter Plots of a Line in a PowerPoint PresentationThis slideshow lesson is very animated with a flow-through technique. I developed the lesson for my 8th grade class, but it can also be used for upper level class reviews. This lesson teaches how to construct and interpret scatter plots, and describe patterns in scatter plots.This lesson has SKELETON NOTES, notes that have the problem only. I used this with our 1-1 district devices. This will allow for the student
Subjects:
Grades:
6th - 8th
CCSS:
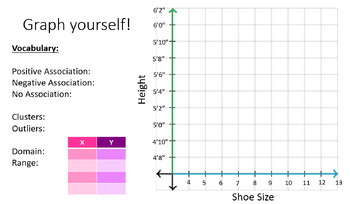
Scatterplots and 2-way Tables
Includes 3 PowerPoints and 2 notes pages.Students will plot themselves on the chart/graph. The class will then discuss trends, collect data, and find percentages based on the students' information.Note: some of the 2-way tables say male/female. I tell my students, "I don't care where you put yourself. You can put yourself as a female on this slide and male on the next. It doesn't matter. We're just collecting data." If you would prefer, you can skip those slides or alter them to fit your class.
Subjects:
Grades:
7th - 9th
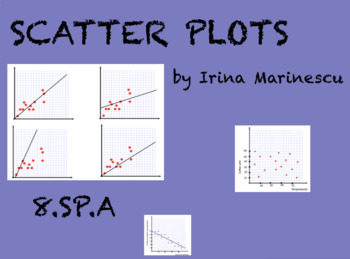
Smartboard Math Lessons - Scatter Plots 8.SP.A
Scatter Plots Bundle of Smartboard Lessons and Practice - 8.SP.A
Showing 1-13 of 13 results

