9 results
Common Core 6.SP.B.5 resources for SMART Notebook
Grade 6 Math Entire Year Smartboard Bundle
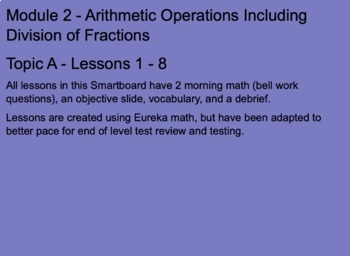
This download includes 6 units of Smartboard lessons that each have daily bell work, standard based objectives, vocabulary, whole group, partner work, individual practice slides and a debrief slide. Lessons that have integrated Kagan strategies have word documents with printable Word document worksheets. There are end of module review lessons and activities (including bingo and jeopardy) in each unit.
Subjects:
Grades:
5th - 8th
Stem and Leaf Plots Smartboard Slides Lesson Stem & Leaf Plot Displaying Data
Math Teachers ~ You'll LOVE this FABULOUS Stem-and-Leaf-Plots Smartboard-Slides-Lesson has 25 slides ~providing a super, thorough lesson on Stem-and-Leaf Plots. Explains, Tells How to Create them, How to read them, and how to find the mean, median, mode, and range from them. Students will enjoy the easy to understand teaching strategies, along with the great interactive practice provided. You'll use this year after year to teach Stem -n-Leaf Plots. WARNING: You MUST have SMART Technologies SMART
Subjects:
Grades:
4th - 7th, Staff
Dot Plots and Data Distribution Displays Smartboard Slides Lesson
Dot-Plots and Data-Distribution Smartboard-Slides-Lesson covers Data-Distribution and Creating Dot-Plots. Lots of practice problems provided. You'll love using this Smartboard Lesson to teach from year after year! WARNING: You MUST have SMART Technologies SMART software, and a SMARTBOARD to teach from, to effectively download, open and use this Interactive Smartboard Lesson. Go to https://legacy.smarttech.com/en/products/education-software/smart-learning-suite/download/trial to download a free t
Subjects:
Grades:
4th - 7th, Staff
Histograms Smartboard Lesson Data Displays Graphs Graphing
TERRIFIC Histograms-Smartboard-Slides-Lesson covers what a Histogram is, what they look like, features specific to Histograms, and lots of interactive practice for students to create Histograms and be able to read Histograms and find answers. This smartboard lesson also combines activities to practice Histograms. Your students will LOVE learning about Histograms with this Smartboard Lesson. You'll use this year after year to teach Histograms. Created by Tricks and Treats for Teaching. WARNING: Y
Subjects:
Grades:
4th - 6th
Median Mode Range Smartboard Slides Lesson Measures of Central Tendency
Incredible ~ 31 slides ~ Smartboard-Slides-Math-Lesson over Median, Mode, and Range (Measures of Central Tendency). This is EVERYTHING you need to teach these three measure-of-central-tendencies. Students will enjoy the interactive slides where they work problems at the Smartboard. Please be sure to see my other smartboard lesson on Finding the Mean, Average. You'll enjoy using this resource year after year. WARNING: You MUST have SMART Technologies SMART software, and a SMARTBOARD to teach from
Subjects:
Grades:
4th - 7th, Staff
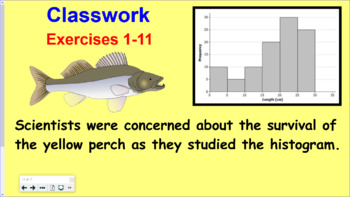
Engage NY (Eureka) 6th Grade Common Core Math Module 6-Topic D
If you love Engage NY, but are looking for a more engaging way to teach the modules, you have come to the right place! This notebook file for SmartBoard follows the 6th grade Module 6-Topic D, Lessons 17 – 22. If you like these lessons, follow me for full topic notebooks for more topics, other modules and grade levels. Save time and energy while engaging students in common core math! These lessons cover summarizing and describing distributions. Engage NY created the modules, I made them eas
Subjects:
Grades:
6th

Engage NY (Eureka) 6th Grade Common Core Math Module 6-Topic C
If you love Engage NY, but are looking for a more engaging way to teach the modules, you have come to the right place! This notebook file for SmartBoard follows the 6th grade Module 6-Topic C, Lessons 12 - 16. If you like these lessons, follow me for full topic notebooks for more topics, other modules and grade levels. Save time and energy while engaging students in common core math! These lessons cover summarizing a distribution that is skewed using the median and the interquartile range.
Subjects:
Grades:
6th
Basic Probability Smartboard Slides Lesson Word Problems Applications
This is a FABULOUS Smartboard-Lesson (24 slides total) for Applications-of Basic-Probability. This can be used as Math on the Move, Task Cards, Math Station, etc. TERRIFIC Basic Probability Word Problems. Everything you need to teach basic probability to your math class. Your students and you will both LOVE this! You'll enjoy using it year after year!WARNING: You MUST have SMART Technologies SMART software, and a SMARTBOARD to teach from, to effectively download, open and use this Interactive Sm
Subjects:
Grades:
6th - 8th, Staff

Theoretical and Experimental Probability
Notes and practice problems over theoretical and experimental probability
Subjects:
Grades:
6th - 8th
Types:
Showing 1-9 of 9 results

