50 results
Applied math Common Core 8.SP.A.2 resources
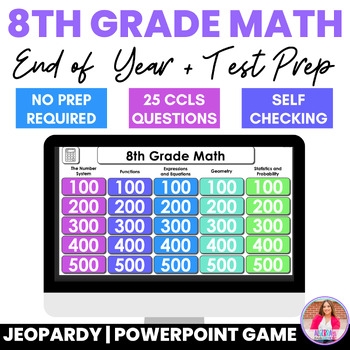
8th Grade Math Skills End of Year Review Test Prep PowerPoint Game Jeopardy EOC
Looking for a fun and engaging way to review essential 8th Grade Math Skills for example The Number System, Functions, Expressions and Equations, Geometry and Statistics, and Probability. This End of Year Math Review Jeopardy game is a super fun, interactive and engaging activity for students and EASY for busy teachers to use. This No Prep Powerpoint Game, is everything you need to review important eighth grade math skills in no time at all! There are 25 CCLS aligned questions with different poi
Subjects:
Grades:
8th
Middle School Math Interactive Notebook Bundle - 6th 7th 8th TEKS CCSS
This MEGA Bundle contains lessons for an Interactive Notebook for 6th, 7th and 8th Grade Math. This Ultimate Bundle not only provides the Flippables (foldable activities) but also items necessary to complete your Interactive Notebook (INB) lessons as well as an online photo gallery for each of the grade levels sorted by unit.Includes:► 6th Grade INB Unit for The Number System► 6th Grade INB Unit for Ratios and Proportional Reasoning► 6th Grade INB Unit for Expressions► 6th Grade INB Unit for One
Subjects:
Grades:
6th - 8th
8th Grade Math - END OF YEAR PROJECT (EDITABLE!)
This is a great way to wrap up the year with an 8th grade math class! Students create a fun Review Book that asks them to summarize everything they've learned... while using lots of color and flexing their creativity! * TEACH MULTIPLE SUBJECTS? Check out these other End-of-Year Projects:Bundle of 6th, 7th & 8th Grade Math ($8 discount!)7th Grade Math6th Grade Math ALL of the Common Core 8th Grade math standards are covered! The packet attached starts with clear, page-by-page directions for t
Subjects:
Grades:
8th
Types:
Also included in: Middle School Math - End of Year Project BUNDLE!
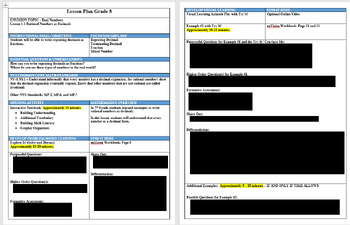
8th Grade Math enVision Lesson Plans - ENTIRE CURRICULUM - THE WHOLE YEAR
This BUNDLE includes 52 LESSON PLANS!This is for the ENTIRE 8th GRADE enVision CURRICULUM!All lesson plans are EXTREMELY DETAILED and directly connect to the enVision Math Curriculum for 8th grade. These are JUST THE LESSON PLAN DOCUMENTS, NOT the actual activities or assessment tools. The lessons included in this bundle are for ALL 8 TOPICS!!TOPIC 1 - Real NumbersLesson 1-1: Rational Numbers as DecimalsLesson 1-2: Understand Irrational NumbersLesson 1-3: Compare and Order Real NumbersLesson
Subjects:
Grades:
8th
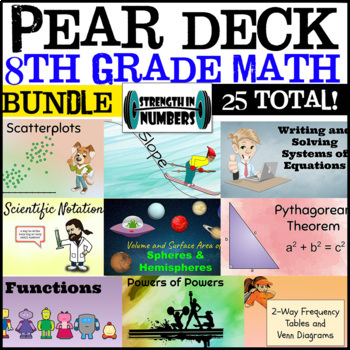
8th Grade Math 8 Complete Year BUNDLE 25 Google Slides/Pear Deck
This bundle includes all the 8th grade math digital activities for Google Slides with Pear Deck add-on. Works great with in-person or distance learning. Watch students work in real time and share answers with the class without showing names.All slides are completely editable - you can even add your own bitmoji! 25 total presentations!Topics include:Multi-Step EquationsWriting Equations2-Way Frequency TablesRelative Frequency TablesScatterplotsScientific Notation (writing, adding, subtracting,
Subjects:
Grades:
8th
Types:
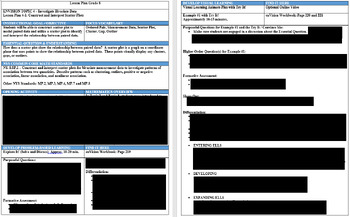
8th Grade enVision Lesson Plans MATH Topic 4 - Investigate Bivariate Data BUNDLE
This BUNDLE includes FIVE LESSON PLANS. All lesson plans are EXTREMELY DETAILED and directly connects to the enVision Math Curriculum for 8th grade. These are JUST THE LESSON PLAN DOCUMENTS, NOT the actual activities or assessment tools. The lessons included in this bundle are for Topic 4 - Investigate Bivariate Data. The lesson titles are as follows: Lesson 4-1: Construct and Interpret Scatter PlotsLesson 4-2: Analyze Linear AssociationsLesson 4-3: Use Linear Models to Make PredictionsLe
Subjects:
Grades:
8th
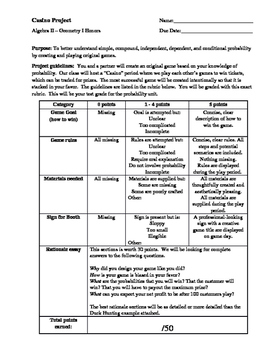
Carnival Probability Project
A project that feels like a game!
Students must create their own game, using probability to ensure THEY are favored to win....much like the house in a casino. Students can make games involving dice, spinners, cards, "fishing" ducks out of a pond, etc.
Assessed skills include: fundamental counting principal, theoretical probability, experimental probability, independent events, dependent events, creativity, writing, presentation. *Students must already know basic probability to complete this
Subjects:
Grades:
8th - 12th
Types:
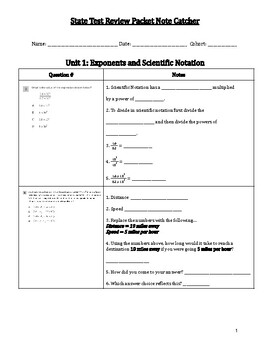
Math 8 State Test Prep
This bundle includes two separate packets for math state test prep. One packet includes redistributed released state test questions where topics are chunked together. The other packet takes each question and provides 3 - 10 scaffolding questions to help students elicit the correct response. Scaffolding questions include references to previous learning and ways to rethink complicated state test wording. This packet can be covered over the course of a week (with two units completed each day) for j
Subjects:
Grades:
7th - 9th
Types:
Also included in: Math State Test Prep Bundle
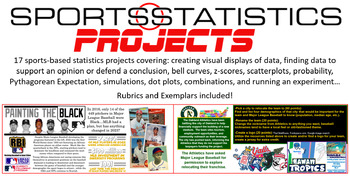
Sports Statistics - Projects ONLY! 17 projects in all
Most of the projects allow students to choose their own topic to display their understanding of statistical topics. Students will:Create a graph of their choosing given dataDesign an infographic on the subject of their choosingResearch and defend their G.O.A.T. choice in a variety of categoriesUse demographics to relocate and rebrand a professional franchiseResearch social injustices in sports and display the dataCreate a bell curve based on career statistics of Michael JordanCompare the salari
Subjects:
Grades:
8th - 12th
CCSS:
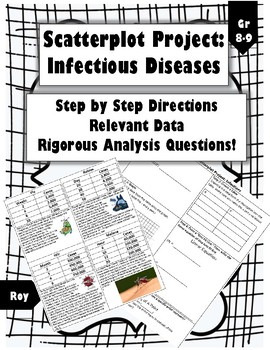
Fun Scatterplot Project: Infectious Diseases
Hello! This fun project helps kids understand the importance of scatterplots and trends in connection to infectious diseases. It is a self-directed project with step by step directions so students know what is expected of them. 4 options are given, allowing students to choose which disease they prefer to focus on. They graph the data, analyze a best fit line, then answer rigorous analysis questions. My students love this project as it sparks interesting conversations about the "scariest" infecti
Subjects:
Grades:
8th
Also included in: Scatterplots Bundle (Weeks of Products!)
Scatterplots Bundle (Weeks of Products!)
This bundle includes a multitude of resources that can be used flexibly to meet the needs of your students. Such products include Stations, Projects, Guided Notes, Vocabulary Sorts, Exit Tickets, Homework, and general Practice Problems. The materials are common-core aligned and accessible to students of different needs. The vocab sort is especially useful for ELLs. Relevant and real-world data is used to ensure students understand the purpose of Scatterplots. This is a growing bundle. Enjoy!
Subjects:
Grades:
8th
Types:
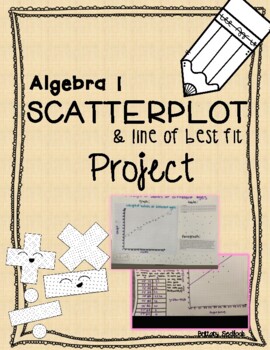
Scatterplot (Line of Best Fit) Project
This is an engaging and relevant real-life project for Algebra 1 (Math) students to analyze and organize data into a table and scatterplot. Students will choose a topic with 2 variables that they think will be correlated. Then, they will create a table and scatterplot of the data. Finally, they will construct the equation for the line of best fit, discuss and analyze their results in paragraph form, and make a prediction using their line of best fit. This is a great project to conclude a scatter
Subjects:
Grades:
8th - 10th
Types:
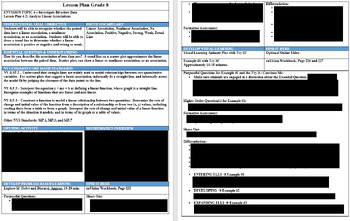
8th Grade enVision Lesson Plan 4-2: Analyze Linear Associations
This is an EXTREMELY DETAILED lesson plan that directly connects to the enVision Math Curriculum for 8th grade. This is one of five lesson plans available for this unit. There is also a BUNDLE on my TPT store, were you can save money by purchasing all lesson plans together at once.This is JUST THE LESSON PLAN DOCUMENT, NOT the actual activities or assessment tools. This lesson plan is 4 pages long and includes the following categories:- enVision Topic- Next Generation / Common Core Standards
Subjects:
Grades:
8th
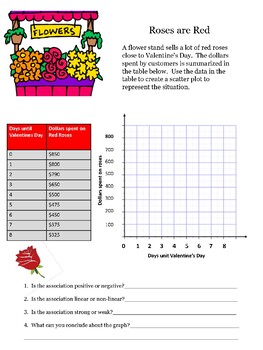
Valentine's Day Scatter Plot
Graph data points and determine the type of plot. You could also add line of best fit or slope to these graphs if you want to take this to the next level.
Subjects:
Grades:
7th - 9th
Types:
Maths Jumbo Math Escape Room Bundle (Algebra, Fractions, Geometry, Shape & More)
20 different Math Escape Rooms in this Bundle of escape room challenges / resources and lessons. Maths Jumbo Math Escape Room Bundle (Algebra, Fractions, Geometry, Shape & More). This is a huge collection of unique digital print and play escape rooms. Every student loves to solve a mystery. These new escape room activities will not only improve students knowledge of a wide range of Math topics but will also hone their problem solving skills, build up their teamwork and leadership skills and
Subjects:
Grades:
7th - 11th
Complete Lesson Collection - 62 Lessons 298 pages
Every lesson that Make Math More has ever created in one GIANT PDF download! 62 lessons and 298 Pages worth of real-life, engaging math activities. That makes it only $0.75 per lesson. Lesson Plans and Student Guides are included for every lesson. Most Common Core standards are covered in grades 6-8 (see contents below), but teachers have adapted and used my lessons well beyond these grade levels. See the full list below and enjoy the lessons!Candy Split - Students will use candy to explore what
Subjects:
Grades:
4th - 10th
Types:
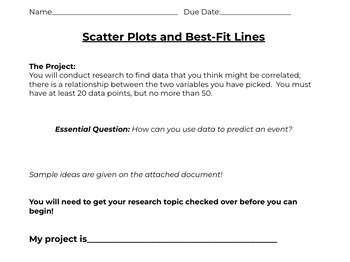
Scatter Plots and Lines of Best Fit - PROJECT BASED LEARNING
MATH with MANNIXProject Based LearningSWBAT research their own topic to see if there is a correlation.SWBAT gather their own data and create scatter plots and lines of best fitSWBAT interpret and describe their findingsSWBAT analyze classmates findings GoogleDrive- Includes GoogleSlides and GoogleDocsCan be used for individuals or groups!What is included...Outline of projectRubricData SheetsSentence Starters/Why we write in math docGoogleSlide TemplateClassmate Reflection sheetConstruct and int
8th Grade Math - 97 PowerPoint Lessons!
97 Lessons and PowerPoint Presentations! Approximately 20-25 slides per lesson.Literally thousands of slides!!!Perfect for the new teacher, substitutes, a teacher teaching math for the first time, etc.Topics:1-1 Variables & Expressions1-2 Algebraic Expressions1-3 Integers & Absolute Value1-4 Adding Integers1-5 Subtracting Integers1-6 Multiplying and Dividing Integers1-7 Solve Equations - Add/Subtract1-8 Solve Equations - Multiply/Divide1-9 Inequalities2-3 Adding & Subtracting Ration
Subjects:
Grades:
7th - 9th
Types:
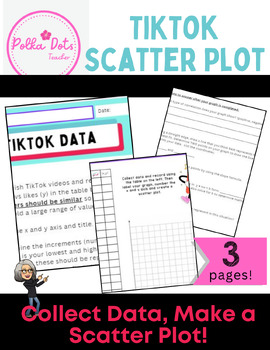
TikTock Scatter Plot and Line of Best fit Data Activity
Students will LOVE collecting data from TikTok! Students keep track of the number of shares and likes each viral video has to create a scatter plot, line of best fit. This activity works best when the videos the choose have similar data points (so viral videos in the millions OR non-viral videos with low numbers). If you do NOT want your students on TIKTOK or their phones, you can easily provide the data for them...but they LOVE collecting on their own!
Subjects:
Grades:
7th - 12th, Higher Education, Adult Education
Types:
Statistics Math Resources Activities
Statistics - Math resources for Middle and High school students. Huge bundle of Math education teaching and learning resources to teach the topic Statistics. Answers included with every resource and activity. The resources come in editable format so you can amend and make changes if you wish. Contents of Statistics Math Bundle ☞ 1 x Revision Quiz with over 50+ Questions ☞ 1 x Escape Room with all resources - Great Fun! ☞ 1 x set of 24 task cards on topic ☞ 1 x Set of Digital Tarsia Puzzles☞ 1 x
Subjects:
Grades:
7th - 11th
Collecting & Analyzing Data Project | Line of Best Fit | Correlation Coefficient
Give your students some practical, real-world experience with this data-analyzing project. Things to know: 1. Prior to completing this project, students must be somewhat familiar with scatter plots, lines of best fit, correlation coefficients, and data displays. 2. This project will require collecting data via surveys. 3. Great group projects. 4. Allows for students to be creative and look for correlations between things they are interested in.
Subjects:
Grades:
8th - 10th
CCSS:
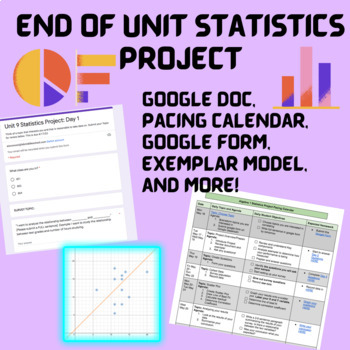
End of Unit Statistics Project- Collecting and Analyzing Data!
This is an amazing hands off project for your students to work on during their statistics unit. I often replace our end of unit test with this project, and make it a take-home assessment so they are doing most of the work for homework, but you could easily build it into your class periods! Students will be required to: come up with a survey topic determine population, sample, and questionsgather the data and turn it into a scatterplotdetermining the line of best fitresidualscorrelation coefficie
Subjects:
Grades:
6th - 12th
Types:
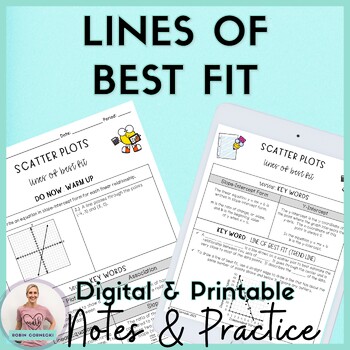
Lines of Best Fit Guided Notes Homework for 8th Grade Math Pre Algebra
Lines of Best Fit Guided Notes is everything that you need to teach your middle school math students how to find trend lines and their associations. Students will learn how to find the line of best fit from a scatter plot through an investigation and practice examples. These guided notes and practice worksheets are perfect for a binder or can be reduced in size to fit into an interactive notebook.✅This resource is perfect for Distance Learning (zero prep) or in the classroom. It can be used wi
Subjects:
Grades:
7th - 9th
Types:
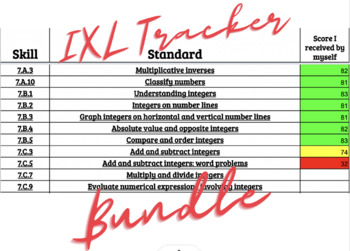
3rd-8th Grade IXL Math Digitial Trackers
Do you teach only one grade but have a classroom full of students who academically perform on different grade levels? Do you want to make sure you target the multiple skills each of those students need?Purchase the bundle and assign (via Google Classroom) a document to each student based on their performance level! It's as simple as that!Students will become independent and strong mathematicians. SIt back and watch them grow!
Subjects:
Grades:
3rd - 8th
Types:
Showing 1-24 of 50 results


