15 results
Graphing Common Core HSN-Q.A.1 resources
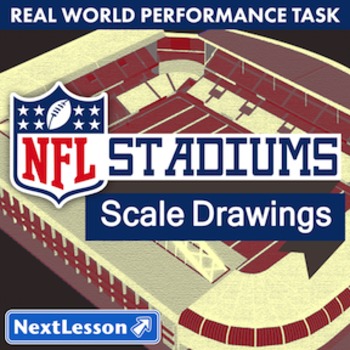
BUNDLE – Performance Task – Scale Drawings - NFL Stadiums - Football Teams
BUNDLE – Performance Task – Scale Drawings - NFL Stadiums - Football Teams
Now you can get more options and save money with this collection of all editions of NFL Stadiums!
This set includes the NFL Stadiums Performance Task in 32 different football team editions. If you were to purchase each of these Performance Tasks individually, it would cost $128. At only $7, this bundle saves you about 95% off retail price!
In the NFL Stadiums Performance Task, students use architectural data of an NFL
Subjects:
Grades:
9th - 12th
Types:
CCSS:
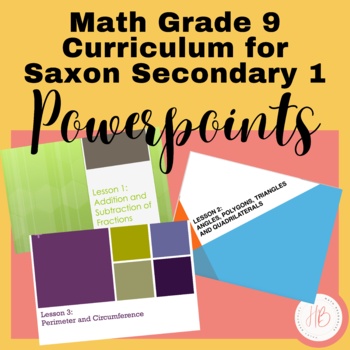
9th Grade Saxon Secondary 1 Math Powerpoints
These 120 Powerpoint lessons work hand in hand with the Saxon Algebra 1 math textbook. If you do not teach the Saxon program then these Powerpoints can be used to help teach the Secondary 1 Common Core. Each Powerpoint consists of a lesson overview which includes formulas and direct instructions. After that there are several practice problems that allows students to put into practice what they just learned. This is a great opportunity for group work as well as for the teacher to walk around the
Grades:
8th - 9th
Types:
CCSS:

Road Trip Project (Distance & Midpoint)
In this project, students will plan a 3 day (or 3 stop) road trip within the continental United States. There is a map laid over a coordinate plane so that students can mark their starting point and their 3 different stops. Students will then calculate the distance that they travel between each stop and find a midpoint for gas/food/bathroom/etc. This project combines a review of the coordinate plane, distance, midpoint, and geography.This project is 3 pages. The first is the map on a coordinate
Grades:
6th - 12th
Types:
CCSS:
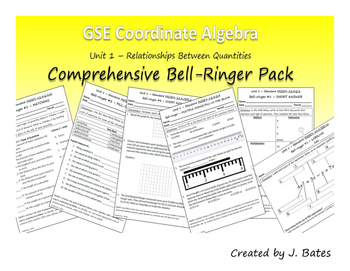
Coordinate Algebra Unit 1 Bell-Ringer Pack (Relationships Between Quantities)
This pack contains a set of 22 bell-ringer tasks aligned to each of the standards for Unit 1 of Coordinate Algebra - Relationships Between Quantities. They are designed to serve as short opening activities for your classes, as well as to be quick and easy to grade.
To conserve paper, each of the 22 pages contains two copies of the same task and a cut line so you only use half a sheet of paper per task per student.
Each bell-ringer task is headed with the standard number it is aligned to as we
Subjects:
Grades:
8th - 10th
Types:
CCSS:

MEAN, MEDIAN,MODE, STEM AND LEAF, and BOX AND WHISKER
MEAN, MEDIAN,MODE, STEM AND LEAF, and BOX AND WHISKERAlso, Graphing Inequalities. No graphs included
Grades:
8th - 9th
Types:
CCSS:
Algebra 1 Lesson - Representing Relations
This complete lesson can be used with any curriculum and each student will be able to:represent relationsinterpret graphs of relationschoose and interpret appropriate scales for the axes and origin of graphsThis lesson is done with a bohemian style color pallet; all material is editable, if you need to adjust to your teaching style or your classroom curriculum. Answer key included!!
Grades:
9th - 12th
CCSS:
Also included in: Algebra 1 Lesson BUNDLE - Complete Course
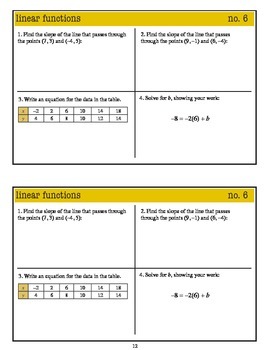
Algebra 1 Warm Ups: Linear Functions (Common Core standards)
Set includes 18 different daily warm ups, each with an answer key.
This set of warmups is great for review of the Algebra 1 Common Core standards each day. I have these waiting on the students' desks when they come in, and after a set amount of time we go over the answers together, usually with several students taking turns doing the warmup under the doc cam. Depending on the pacing of the day, I may have students complete only two of the problems, or even just one if it is a complex problem.
Subjects:
Grades:
7th - 10th
Types:
CCSS:
Introduction to Linear Equations Using Data: Lesson Plan for a Group Activity
LESSON PURPOSE:This lesson plan introduces linear equations by having a group of students model real, quickly-gathered class data. The goal is to help motivate student interest in data collection, graphing, linear equations, and slope, while minimizing the time normally needed to collect data in other contexts.This is a .zip file including an editable PowerPoint of the lesson, a PDF of the slides that can be distributed or uploaded, a PDF of the teacher notes that the instructor can refer to as
Grades:
8th - 12th, Higher Education, Adult Education
CCSS:
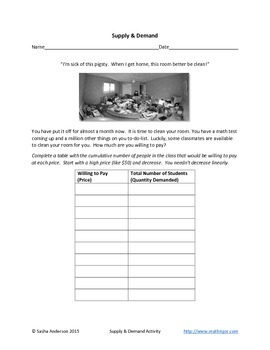
Supply and demand
A classroom activity where student build their own demand and supply curves based on what they are willing to pay (or be paid) for a clean room. Students must reason quantitatively and use units common in economics to solve problems in market equilibrium. Algebra- linear equations, systems of equations, and functions.
Subjects:
Grades:
9th - 12th, Higher Education, Adult Education
Types:
CCSS:
Graph a Linear Function Rule Using a Table
Students will practice graphing equations that represent functions. Using the table, students will substitute each x value into the equation, simplify the equation, write the corresponding y value and ordered pair, then graph the ordered pair.
Grades:
7th - 10th
CCSS:
One variable Inequalities on a number line scaffolded fillable notes
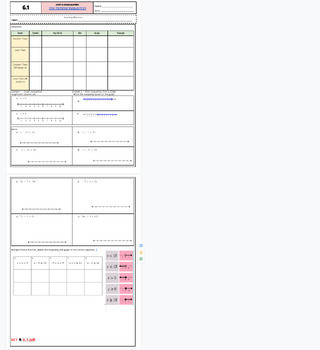
Unit 6 Inequalities6.1 is one variable inequalities students will solve these 1 to 2-step inequalities and graph them on a number line with open or closed dots and the arrow going right or left. A vocab table goes over the basics and rules for inequalities. KEY is included linked in the header in red and at the bottom of the google doc. Doc is editable to your liking. Please note: multiplying and dividing by a negative rule is NOT included in these notes for the reason this is an overall intro l
Subjects:
Grades:
6th - 12th, Higher Education, Adult Education
CCSS:
Also included in: Inequalities Unit Fillable Notes & Key Only
Graphing Absolute Value Functions
This activity allows students to explore transformations with Absolute Value Functions by breaking down each type of transformation and having students reflect on their graphs. This is a really helpful intro activity because the only prior knowledge needed is how to graph using an x/y table. Make sure students have rulers and colored pencils for the activity.
Subjects:
Grades:
8th - 12th
Types:
CCSS:

Colorful Solutions: Interdisciplinary Science Mini-Unit
This FREE, interdisciplinary mini-unit is all about how chemical engineering produces dyes to brighten lives. The Gist: Students will learn to think like chemical engineers as they delve into the dye technologies that allow us to express ourselves through colorful clothing. They will read and discuss complex texts, analyze concept maps and graphs, and develop an appreciation for indigenous (Māori) dye technology.Driving Questions:How have different dye technologies been used to produce colorful
Subjects:
Grades:
8th - 12th
CCSS:
NGSS:
MS-ESS3-2
, HS-ETS1-2
, HS-ETS1-1
Graphing Functions - Earn Some Money
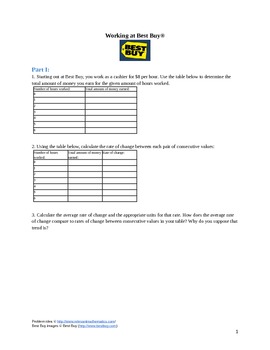
Looking for an activity to teach students how to graph basic functions? This activity has students create a table of values, graph, and equation from a word problem about earning money working for Best Buy.
Subjects:
Grades:
8th - 9th
Types:
Earthworms Response to Temperature
This is a lab for Middle School and High School Science classes. It uses Red Wigglers, Eisenia fetida, to manipulate temperature variables to affect the worm's pulse rate. Red Wigglers are easy to work with and allow students to see the blow flow through the closed circulatory system and calculate the pulse rate of the worm. This lab uses graphing and data collection to help students understand how science accumulates data to make inferences about how conditions affect animals.
Showing 1-15 of 15 results


