17 results
Common Core HSS-ID.A.1 resources for staff
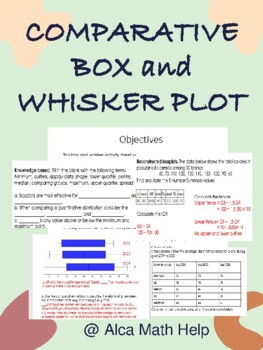
Comparison Box and Whisker Plots Worksheet, Quiz, Test for Stats & AP Stats
This box and whisker activity sheet was designed to test students understanding of the 5 number summary data values given quantitative data sets. Perfect for students in grade 10-12 doing statistics and you want to give them a challenge and should be manageable for students doing AP STATSAt the end of this activity students should be able to1. Students should be able to explain and construct box plots showing the different regions and what they represent. 2. Students should also be able to use
Subjects:
Grades:
11th - 12th, Higher Education, Adult Education, Staff
CCSS:
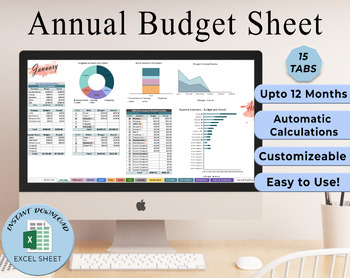
Annual Budget | Budget Template | Personal Budget | Excel Sheets Budget Annual
Annual Budget | Budget Template | Personal Budget | Excel Sheets BudgetCertainly! Here's a basic structure for an Annual Budget Spreadsheet in Microsoft Excel:1. **Income Section**: - Column A: Month (e.g., January, February, March, etc.) - Column B: Income Sources (e.g., Salary, Freelance Income, Rental Income, etc.) - Columns C through N: Monthly Income Amounts2. **Fixed Expenses Section**: - Column A: Expense Categories (e.g., Rent/Mortgage, Utilities, Insurance, Loan Payments, etc.)
Subjects:
Grades:
Higher Education, Adult Education, Staff
CCSS:
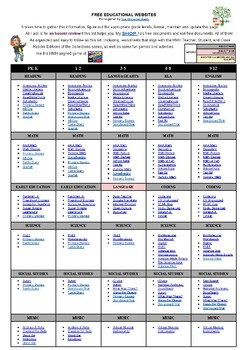
FREE EDUCATIONAL WEBSITES LIST 4 ALL GRADES K-12 AND SUBJECTS + TEACHER RESOURCE
Sometimes, you just need a list of websites for everyone. Here it is. FREE EDUCATIONAL WEBSITES Put together by Teach Me, Maria!It takes time to gather this information, figure out the appropriate grade levels, and format, maintain, and update this page. All I ask is for an honest review if this list helps you.
Subjects:
Grades:
PreK - 12th, Staff
Types:
Box Plot
Box Plot: This packet contains worksheets on box plot. These worksheets are great for differentiation and remediation.
This packet includes:
Anticipation Guide
Anticipation Guide Answer Key
Box Plot Examples
Box Plot Examples Answer Key
Box Plot Practice
Box Plot Extra Practice
Box Plot Extra Practice Answer Key
Error Analysis
Error Analysis Answer Key
Ticket Out the Door
Ticket Out the Door Answer Key
I have more Box Plot resources available.
Click on this link for the box plot coloring ac
Subjects:
Grades:
5th - 12th, Adult Education, Staff
Types:
CCSS:
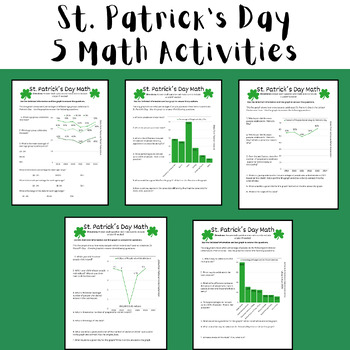
St. Patrick's Day Math Activities (Test Prep Data Analysis) Printable or Digital
These 5 activities are fun NO PREP math activities to do to celebrate St. Patrick's Day. The activities can be completed as 5 separate pages or as a 5 page packet. There is a customizable digital resource (Canva Template) and a printable resource (Canva) that contain the same directions and activity. This was designed for students in middle school, but could be used for upper elementary and high school students in Pre Algebra, Pre-Algebra, or Algebra.In this assignment, students are asked to:Gra
Subjects:
Grades:
3rd - 12th, Staff
Types:
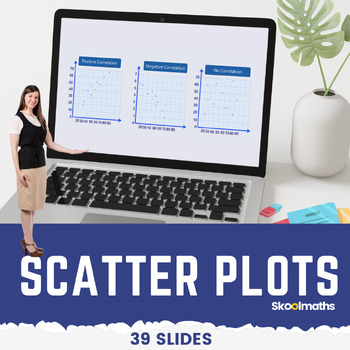
Eight Grade Scatter Plots Digital Math Lesson and Activities CCSS 8.SP.A.1
Eight Grade Scatter Plots Digital Math Lesson and ActivitiesTeach your high school grade how to use and interpret scatter graphs; recognize correlation; draw and use lines of best fit to make predictions?In this lesson, learners will be able to:use and interpret scatter graphs of bivariate data;recognize different types of correlation;draw estimated lines of best fit; anduse lines of best fit to make predictions.
Subjects:
Grades:
8th - 10th, Staff
Types:
CCSS:
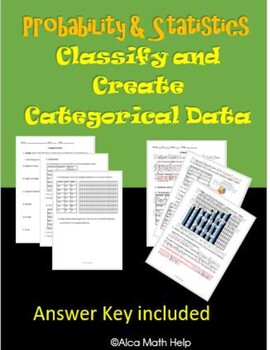
Categorical Data in Statistics (Classify & Create)- CP Stats, HW, CW, Worksheet
If you are looking for an easy to follow for students. You are at the right place. This is a quick and easy to follow activity sheet that brings across the concept clearly and precisely. Teachers in my department love this activity sheet. This is useful for CP Probability and Statistics, AP Statistics and Algebra 1 statistics unit.Categorical data and Display Variables ObjectivesAt the end of the lesson students should be able to:1. Correctly define categorical and quantitative data with exampl
Subjects:
Grades:
8th - 12th, Higher Education, Adult Education, Staff
Types:
CCSS:

6 Editable Bar Graph Templates 2.0
Finally a simple and professional graph space that students can fill out without any design issues getting in the way. This file contains 6 ready-to-use graph options. Print them and have students fill them with pencil and ruler, or distribute them over computer and let them practice entering the data. Get a project perfect finish every time. Maybe you just want to fill it out live on a projector? The possibilities are endless! It's okay to say you love these bar graphs. So do we.Contains:- 2 bl
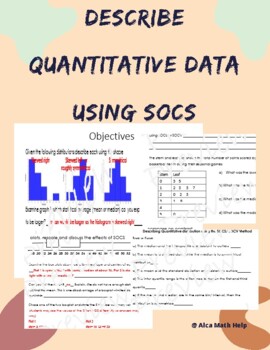
Describe Quantitative Data using SOCS/SOCV- Box plot, Histogram, Stem plot
If you are looking for a worksheet that can be used as a quiz, test, review packet you are at the right place. This activity sheet is suitable for students doing AP Stats and CP Probability and Statistics. This activity sheet allows students to:Use prior knowledge to answer true false questions and fill in the blanks with vocabulary provided.Describe box plots, histogram and stem plot using SOCS.Interpret the shape, center, outlier or any unusual feature along with the spread.
Subjects:
Grades:
11th - 12th, Higher Education, Adult Education, Staff
CCSS:
Box Plot Coloring Activity
Box Plot: Students will enjoy this box plot coloring activity. This activity is great for remediation and differentiation.
I have more Box Plot resources available.
Click on this link for the box plot no prep lesson.
Click on this link for the box plot scramble puzzle.
Subjects:
Grades:
5th - 12th, Adult Education, Staff
Types:
CCSS:

Entire year of Algebra 1 tests - 3 versions each - Similar to NYS Regents
This bundle includes 3 versions of each unit test for Algebra 1. The unit tests are: Introduction to AlgebraFunctionsLinear, Exponential Functions & SequencesSystems of EquationsQuadratic FunctionsPolynomialsStatisticsAlso included are 3 versions of quizzes for Equations and SequencesThis bundle has all units test you need for a complete Algebra 1 Common Core course. Each version is very similar to the others; the problems have different numbers but the type and level of problem is the same
Subjects:
Grades:
7th - 10th, Staff
Types:
CCSS:
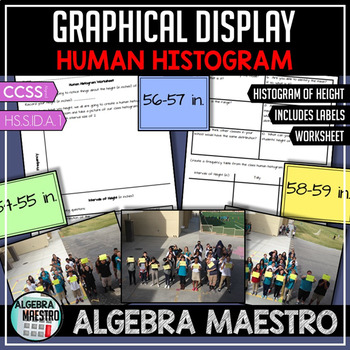
Human Histogram Activity & Worksheet
Human Histogram Activity & Worksheet is designed so that students can experience and model real life statistics. Students will create a histogram and analyze trends and statistical measure on an attached worksheet. My students love this activity because it gets the class up, moving, and we can go outside. The worksheet includes questions on measure of center (central tendencies), spread, distribution, and converting to a other data displays (frequency table).Please you review if you downl
Subjects:
Grades:
6th - 12th, Higher Education, Adult Education, Staff
Types:
CCSS:
Box Plot
Box Plot: Students will enjoy this box plot activity and blowing bubbles. Students will be able use real life applications and apply it to mathematics.
Subjects:
Grades:
4th - 12th, Adult Education, Staff
Types:
CCSS:
Box Plot
Box Plot: Students will enjoy this box plot scrambler activity. This activity is great for remediation and differentiation.
I have more Box Plot resources available.
Click on this link for the box plot no prep lesson.
Click on this link for the coloring activity.
Subjects:
Grades:
5th - 12th, Adult Education, Staff
Types:
CCSS:
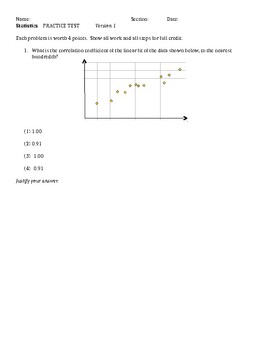
Algebra 1 Tests- Statistics Unit - 3 versions
Included are 3 versions of an Algebra 1 Unit Test on Statistics. The main topics being assessed are interpreting the correlation coefficient, comparing and computing measures of central tendency, finding the least squares regression line and making predictions, constructing a box and whisker plot, using quadratic regression and constructing and interpreting a residual graph. Each version is very similar to the others; the problems have different numbers but the type and level of problem is the
Subjects:
Grades:
8th - 10th, Staff
Types:
CCSS:
Statistics and Probability CCSS checklist (trimesters)
This document is a checklist for the Statistics and Probability Common Core State Standards framework. There are multiple columns included to be able to use this document as a checklist for which common core standards you have taught within your course(s) and a column to notate when, how, where you used each standard. This is very useful for planning and implementation of curriculum on an annual basis.
Included in the document are the Standards for Mathematical Practice as well as the CCSS fram
Subjects:
Grades:
9th - 12th, Staff
CCSS:
Statistics and Probability CCSS checklist (quarters)
This document is a checklist for the Statistics and Probability Common Core State Standards framework. There are multiple columns included to be able to use this document as a checklist for which common core standards you have taught within your course(s) and a column to notate when, how, where you used each standard. This is very useful for planning and implementation of curriculum on an annual basis.
Included in the document are the Standards for Mathematical Practice as well as the CCSS fram
Subjects:
Grades:
9th - 12th, Staff
CCSS:
Showing 1-17 of 17 results

