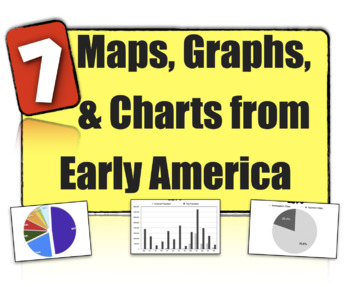
7 Charts, Maps, & Graphs from Early America: Map Skills & Content Together!
- Zip
What educators are saying
Also included in
- The American History US History Part 1 Curriculum PLUS: (1590-1877) contains thousands of pages of materials across 13 American History units and supplement bundles, including assessments, interactive notebooks, Google 1:1 resources, Escape Room breakouts, and much, much more.Purchase this and enjoyPrice $479.99Original Price $951.16Save $471.17
- The Skill-Building Bundle! Integrating Geography and Math into Social Studies!In this "skill-building" bundle, receive two bundles focused on teaching and improving geography, map, and math skills in the social studies classroom! Buy this bundle and save even more!1.) In the Different Maps for DiPrice $29.99Original Price $36.92Save $6.93
- The 21 American History maps, graphs, and charts bundle is a collection of three products already on Teachers Pay Teachers. This is an outstanding way to infuse daily warmups, skill-building activities, and integrate math and data into history class!All three of these products feature 7 maps, graphPrice $10.99Original Price $11.97Save $0.98
Description
Included are 7 American History history maps, graphs, and charts activities that can be used to integrate math and data skills into early US American history. These 7 activities help teach essential chart, graph, and map skills and can be easily used as history warmups, bellringers, or homework exercises.
These American History data sets work best when used with 13 Colonies content, Early America, Washington's Presidency, or a New Nation unit.
These activities can be used as daily warmups or to enhance graph skills in isolation. Answers are fairly self-explanatory, except for a couple which require math calculations. An answer key has been provided!
The 7 activities include:
- Total Population, 1790
- Comparing Population of the Top 10 U.S. Cities, 1790
- Growth in Total American Population, 1630 to 1770
- Country of Origin of US Population before 1790
- Colonial Exports in 1770
- Colonial Growth from 1700 to 1780
- Urban and Rural Populations, 1790 to 2000
This set of charts, maps, and graphs is part of the much larger 21 Maps, Graphs, and Charts in American History bundle, located here! Purchase the bundle and save a bundle!
Be sure to follow the History with Mr E Facebook page, and don't forget to signup for the Social Studies Newsletter to receive information on flash sales, product releases, and classroom tips!
----


