Box and Whisker Plots | Data Analysis Math Notes and Practice
- Zip
- Google Apps™

What educators are saying
Also included in
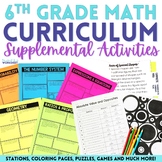
- ⭐️⭐️⭐️ This HUGE BUNDLE includes a full year of 6th Grade Curriculum Supplemental Activities! This bundle includes most of the supplemental resources in my store that align to 6th grade math standards. ⭐️⭐️⭐️ Included are supplemental notes, activities, assessments, fold and flip notes, worksheets, etc.❤️Price $400.00Original Price $645.18Save $245.18
- ⭐️⭐️⭐️ Transform your classroom with a full year of engaging math instruction and supplemental resources! This bundle includes 165 days of editable instructional materials covering essential 6th grade math topics, PLUS over 110 supplemental activities.✅ What's Included:Pacing guides, notes, foldable anPrice $450.00Original Price $819.76Save $369.76
Description
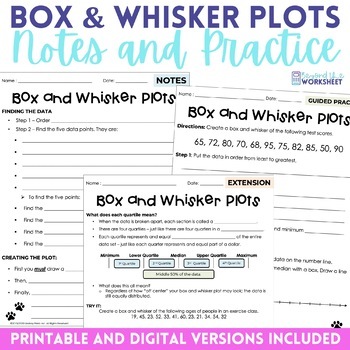
⭐️⭐️ Elevate Data Analysis Skills with this Box and Whisker Plot Activity! This comprehensive resource takes students on a step-by-step journey to master the art of creating and interpreting box and whisker plots, a crucial skill for understanding data distribution.
✅ What's Included:
- Detailed Instructional Notes: A page of in-depth guidance ensures students grasp the concept thoroughly.
- Guided Practice Sheet: Hands-on learning becomes a breeze with this interactive worksheet.
- Extension Sheet: Challenge advanced learners with opportunities for in-depth exploration.
- Comprehensive Answer Keys: Streamline assessment and ensure efficient learning outcomes.
- Google Slides Version: Seamlessly integrate this resource into interactive and digital classrooms for enhanced engagement.
❤️ Perfect for Versatile Learning Environments:
- Whether you're teaching in-person or remotely, this activity is adaptable to various learning environments.
- It's the perfect tool for helping students visualize and interpret data effectively.
✅ Available in the following bundle:
✅ The digital portion is available in my 6th Grade Digital Bundle.
Licensing Terms :
By purchasing this product, you own a license for one teacher only for personal use in their own classroom. Licenses are non-transferable and therefore can not be passed from one teacher to another. If the teacher who purchased this license leaves the classroom or changes schools, the license and materials leave with that teacher. No part of this resource is to be shared with colleagues or used by an entire team, grade level, school or district without purchasing the correct number of licenses. If you are a coach, principal or district interested in transferable licenses that would accommodate yearly staff changes, please contact me for a transferable license quote at lindsay@beyondtheworksheet.com.
Copyright Information :
© Beyond The Worksheet. Please note - all material included in this resource belongs to Beyond The Worksheet Inc. By purchasing, you have a license to use the material but you do not own the material. You may not upload any portion of this resource to the internet in any format, including school/personal websites or network drives unless the site is password protected and can only be accessed by students, not other teachers or anyone else on the internet.
✮✮If you are interested in gaining access to an exclusive set of free resources, CLICK HERE.


