Graphing Sine & Cosine Investigation
Systry
168 Followers
Grade Levels
10th - 12th, Homeschool
Subjects
Resource Type
Standards
CCSSHSF-TF.B.5
Formats Included
- PDF
- Internet Activities
Pages
4 pages
Systry
168 Followers
Compatible with Digital Devices
The Teacher-Author has indicated that this resource can be used for device-based learning.
Description
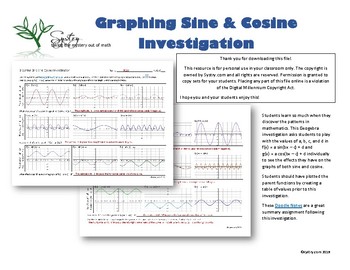
Students learn so much when they discover the patterns in mathematics. This Geogebra investigation asks students to play with the values of a, b, c, and d in f(x) = a sin(bx – c) + d and
g(x) = a cos(bx – c) + d individually to see the effects they have on the graphs of both sine and cosine.
Students should have plotted the parent functions by creating a table of values prior to this investigation.
These Vizual Notes are a great summary assignment following this investigation.
If you are looking for more, I've bundled my trig resources.
Total Pages
4 pages
Answer Key
Included
Teaching Duration
50 minutes
Report this resource to TPT
Reported resources will be reviewed by our team. Report this resource to let us know if this resource violates TPT’s content guidelines.
Standards
to see state-specific standards (only available in the US).
CCSSHSF-TF.B.5
Choose trigonometric functions to model periodic phenomena with specified amplitude, frequency, and midline.


