TPT
Total:
$0.00

Hurricane tracking map with answer keys for five hurricanes

Rated 4.25 out of 5, based on 4 reviews
4.3 (4 ratings)
;
Andrew Gatt
220 Followers
Grade Levels
5th - 9th
Resource Type
Standards
Formats Included
  • PDF
Pages
10 pages
$3.00
$3.00
Share this resource
Report this resource to TPT
Andrew Gatt
220 Followers

What educators are saying

This was a huge help in my student's reviewing for their state test in MS. I appreciate your hard work in compiling this useful information!

Description

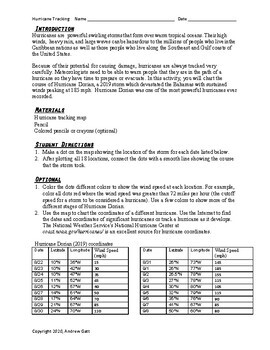
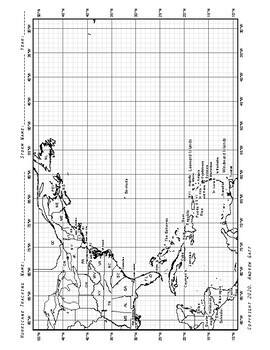
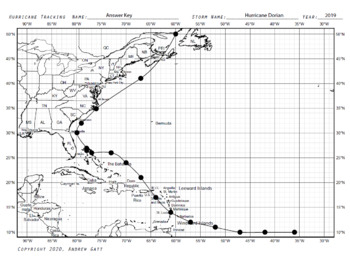
Students learn to plot coordinates of hurricanes using the latitude and longitude of Hurricane Dorian. Daily locations for Hurricane Dorian (2019), rounded to the nearest degree, along with wind speed for each day are arranged in an easy to follow table. The map is an enlarged version of the one used by NOAA for tracking hurricanes. Since the map shows a zoomed-in portion of the Atlantic basin, the latitude and longitude lines are more spread out and easier for students to use. The coordinates for Hurricanes Fran (1996), Katrina (2005), Sandy (2012), and Maria (2017) are included on a separate sheet.

Two other hurricane tracking maps are included in case you want to plot hurricanes that traveled further to the west, or use the full Atlantic basin map provided by NOAA.

Total Pages
10 pages
Answer Key
Included
Teaching Duration
45 minutes
Report this resource to TPT
Reported resources will be reviewed by our team. Report this resource to let us know if this resource violates TPT’s content guidelines.

Standards

to see state-specific standards (only available in the US).
NGSSMS-ESS3-2
Analyze and interpret data on natural hazards to forecast future catastrophic events and inform the development of technologies to mitigate their effects. Emphasis is on how some natural hazards, such as volcanic eruptions and severe weather, are preceded by phenomena that allow for reliable predictions, but others, such as earthquakes, occur suddenly and with no notice, and thus are not yet predictable. Examples of natural hazards can be taken from interior processes (such as earthquakes and volcanic eruptions), surface processes (such as mass wasting and tsunamis), or severe weather events (such as hurricanes, tornadoes, and floods). Examples of data can include the locations, magnitudes, and frequencies of the natural hazards. Examples of technologies can be global (such as satellite systems to monitor hurricanes or forest fires) or local (such as building basements in tornado-prone regions or reservoirs to mitigate droughts).

Reviews

Questions & Answers

220 Followers