
Scatter Plot Project with Real World Sports Data


- PDF
What educators are saying
Also included in
 If you enjoy teaching students using discovery learning and engaging activities with real world connections, this huge pack of resources is here to help you plan your entire year of 8th grade math.Lessons help you teach the standards, encourage discussions, and challenge students to think. StudentsPrice $225.00Original Price $386.46Save $161.46
 Do you love discovery learning, collaboration, hands-on activities, and projects that help students make sense of the math they are learning? This curriculum is packed with engaging and challenging Algebra I and 8th grade math resources for the whole year. A variety of activities, inquiry learningPrice $350.00Original Price $677.94Save $327.94
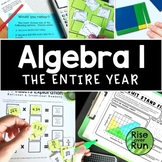 This curriculum bundle includes a variety of activities, assessments, games, group activities, projects, inquiry lessons, guided notes, and more for teaching Algebra I CCSS standards. The activities are centered on discovery learning and engaging activities with real world connections. Lessons helpPrice $225.00Original Price $445.21Save $220.21
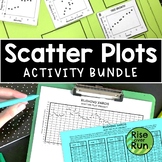 Engage students in learning about scatter plots with this bundle of activities! The activities and lessons include real world examples to help students see the relevance and importance of scatter plots!Included:Scatter Plot Experiment ActivityScatter Plot Practice Sheets (Six Worksheets)Math MeetsPrice $14.00Original Price $20.99Save $6.99
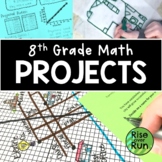 Want to incorporate more PBL in your lessons? Challenge students to use what they have learned in class as they apply 8th grade standards in these real world application projects. Included are 6 engaging projects:Rates & Proportional Relationships Business Startup ProjectTransformations ArchitPrice $14.00Original Price $20.49Save $6.49
Description
Practice creating and analyzing scatter plots with these six differentiated real world projects. Students are provided statistics for a sport and must graph the data. Then, they write an analysis describing correlation, whether or not the data is linear, any outliers, and how the scatter plot might be used to make predictions.
The scatterplots range from 38 points to 149 points, so they can be used to differentiate. The scatter plots will take a little time to plot, but they result in real world graphs along with meaningful and relevant discussions.
Topics include basketball, football, racecars, baseball, and horseracing. A simple rubric is included.
Completed scatterplots are also included if you want your class to practice analyzing without graphing all the points themselves.
These can be used as in-class group projects or take-home individual projects for 8th grade math or Algebra 1. Check out the preview!
