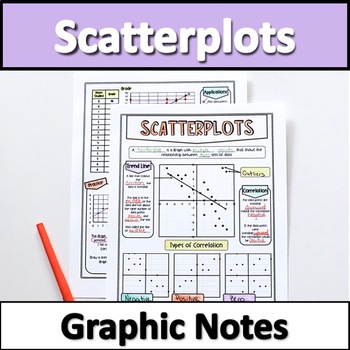
Scatter Plots Graphic Notes
Lauren Fulton
6k Followers
Resource Type
Standards
CCSS8.SP.A.1
CCSS8.SP.A.2
Formats Included
- PDF
Pages
2 + Keys
Lauren Fulton
6k Followers
What educators are saying
My algebra students loved this! Our curriculum is kind of boring with scatterplots, so they enjoyed this more. Very engaging.
Doodle notes are awesome! Scatterplots is a topic that is difficult for some students to fully graph. With doodle notes, they are more engaged. Great resource, highly recommend.
Description
Looking for an engaging way to teach scatter plots? These graphic notes are perfect for student engagement and can double as classroom posters!
These content rich, beautiful notes serve as a great introduction to your unit and work wonderfully as a quick-reference for students. Material Covered: trend lines/line of best fit, outliers, types of correlation (positive, negative, zero), creating & interpreting scatter plots and trend lines.
This Product Includes
- 1 Page of Key Features Scatter Plots
- 1 Page of Practice Creating, Drawing, and Analyzing Trend Lines
- 2 Pages of Teacher Examples/Completed Notes
Related Products
⭐ Key Features of Linear Functions Graphic Notes!
⭐ Pythagorean Theorem Graphic Notes!
⭐ Slope Notes!
Total Pages
2 + Keys
Answer Key
Included
Teaching Duration
40 minutes
Report this resource to TPT
Reported resources will be reviewed by our team. Report this resource to let us know if this resource violates TPT’s content guidelines.
Standards
to see state-specific standards (only available in the US).
CCSS8.SP.A.1
Construct and interpret scatter plots for bivariate measurement data to investigate patterns of association between two quantities. Describe patterns such as clustering, outliers, positive or negative association, linear association, and nonlinear association.
CCSS8.SP.A.2
Know that straight lines are widely used to model relationships between two quantitative variables. For scatter plots that suggest a linear association, informally fit a straight line, and informally assess the model fit by judging the closeness of the data points to the line.


