
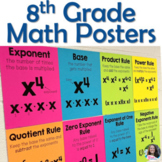
Scatter Plots and Two Way Tables Posters Set for 8th Grade Math Word Wall


- PDF
Also included in
 Middle Grades Math Word Wall Posters. This bundle includes over 100 vocabulary reference posters for all essential vocabulary in 8th grade math. Your word wall is ready to print and go for the whole year!These vocabulary posters contain terms, definitions, visuals, and examples. They are simple andPrice $34.00Original Price $48.00Save $14.00
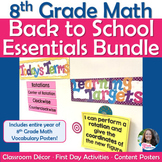 Are you a new 8th grade math teacher? Here's EVERYTHING you need for back to school! Whether you are a first year teacher or switching to 8th grade math, this bundle will save you time and help you get a jump start on your school year! From getting your classroom decorated to being ready with your fPrice $60.00Original Price $92.00Save $32.00
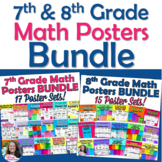 This bundle includes 30 sets of 7th grade and 8th grade math vocabulary posters. Hang them in your math classroom as a quick bulletin board or word wall. With a simple, consistent look, your students will be able to access ALL 7th & 8th grade math vocabulary necessary for learning. The posters sPrice $64.00Original Price $91.25Save $27.25
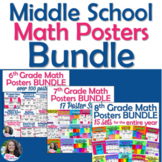 Everything you need for your middle school math word wall! This is the perfect resource for those teaching multiple grade levels. This bundle includes 39 sets of 6th grade, 7th grade, and 8th grade math vocabulary posters.All posters are simple, easy to read, and have all the math information studenPrice $80.00Original Price $118.50Save $38.50
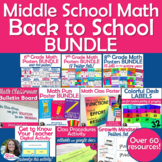 Here is everything you need to start your school year in middle school math! Whether you are a new teacher or switching to grades 6-8 for the first time, this bundle has you covered with vocabulary posters, first day activities, classroom décor, and more! By purchasing this bundle, you save over 35%Price $120.00Original Price $184.75Save $64.75
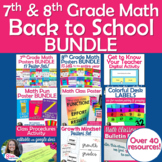 Whether you are a first year teacher or someone switching to 7th & 8th grade math for the first time, this bundle has what you need to get a jump start on your school year! Everything a 7th and 8th grade math teacher could want to get started!Don't fret over how you are going to decorate your clPrice $94.00Original Price $140.50Save $46.50
Description
Make the vocabulary visible and accessible for your students! This set of 12 printable vocabulary posters provides visuals and reminders for your students to reference during your Bivariate Data unit. Display these on your word wall while teaching scatter plots and two-way tables!
The following vocabulary terms are included:
- scatter plot
- positive association or positive correlation
- negative association or negative correlation
- no association or no correlation
- linear association
- nonlinear association
- outlier
- cluster
- line of best fit or trend line or linear model
- slope-intercept form
- two-way table
- relative frequency
They are black and white and can be printed on card stock from your own printer. Or you can print them as large as 18" x 24" to use as 8th grade math anchor charts.
Help your students by hanging these up during your Statistics and Data unit (or all year long)!
>>>This set if part of the 8th Grade Math Vocabulary Posters Full Year Bundle.<<<
Teaching online? Check out these posters in the Scatter Plots & Two-Way Tables Virtual Word Wall.
Please follow me -8th Grade Math Teacher
You may also like...
Scatter Plots Associations Card Sort
Scatter Plots Associations Digital Card Sort
Scatter Plots Correlations Worksheet
8th Grade Math Editable "I Can" Checklists
8th Grade Math Vocabulary Word Wall Cards
7th Grade Statistics Posters Set for Word Wall
Box Plots Vocabulary Posters Set
