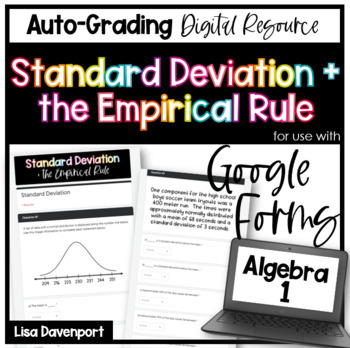
Standard Deviation and the Empirical Rule Google Forms Homework
- Google Drive™ folder

What educators are saying
Also included in
- This bundle includes all SEMESTER 2 Algebra 1 editable Google Forms homework assignments, quizzes, and tests that I have created. Every assignment also includes a "worksheet" that corresponds with the questions on each form. Just assign digitally or print + go!Not 1:1? Not using Google Classroom,Price $45.00Original Price $85.75Save $40.75
- This Algebra 1 Google Forms bundle currently includes auto-grading assignments on the following skills related to data analysis and statistics:Measures of Central TendencyDot Plots and HistogramsBox PlotsStandard Deviation and The Empirical RuleTwo-Way Frequency TablesScatter PlotsEach assignment alPrice $8.00Original Price $10.50Save $2.50
Description
This 18-question, auto-grading Google Forms assignment provides students with practice applying the concepts of mean, standard deviation, and the empirical rule. Students will be asked to approximate/ calculate percentages of data values, given the mean and the standard deviation.
All questions are "drop-down".
This assignment is also included in my Algebra 1 (Semester 2) Bundle for Google Forms
This download also includes a PDF "worksheet" with the exact same questions as the Google Form. Just assign digitally or print + go!
This assignment is also included in my:
Algebra 1 Google Forms (Semester 2) Bundle
You may be interested in some of my other Google Forms Bundles:
- 6th Grade Math
- 7th Grade Math
- 8th Grade Math/ Pre-Algebra
- Algebra 1 Semester 1
- Algebra 1 Semester 2
- High School Geometry
- Algebra 2
You may also be interested in some of my foldable bundles:
★ 5th Grade Foldable + Activity Bundle
★ 6th Grade Math Foldable + Activity Bundle
★ 7th Grade Math Foldable + Activity Bundle
★ 8th Grade Math (Pre-Algebra) Foldable + Activity Bundle
★ Algebra 1 (+Pre-Algebra) Foldable Bundle
★ High School Geometry Foldable Bundle
Questions, concerns, or requests?
Please email me at Lisa@LisaDavenportOnTPT.com


