40 results
Kindergarten graphing resources for Microsoft Excel
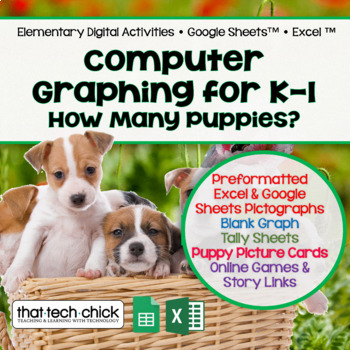
Computer Graphing for K-2 How Many Puppies?
This beginning graphing activity is a great way to differentiate and meet the needs of all your students as they count and sort four different super cute puppies into groups and record their numbers on tally sheets. Students who may struggle can be given fewer types of pictures to sort and/or count, while more advanced students can be challenged with more to count and sort. Once your students enter their data into a prepared spreadsheet, it will automatically create a pictograph!The preformatt
Grades:
K - 2nd
Types:

Computer Graphing for K & 1st Grade-- Can You Catch the Gingerbread Man?
This high interest activity is the perfect thing for the Technology/Computer Lab teacher or the regular classroom teacher to keep their students' attention during the busy holidays. Your kids will sort and count pictures of gingerbread men and record their data as tally marks and/or written numbers. After they finish sorting and counting, they will enter their data into a prepared spreadsheet and generate a super cute pictograph. This activity can be done individually or as a whole group if p
Grades:
K - 2nd
Types:

Halloween Candy Computer Graphing for Primary Kids
Want an engaging way to capitalize your students' excitement about Halloween, technology and math? Creating a pictograph on the computer is an ideal way to combine all three and is ideal for both the Technology Specialist as well as the Classroom Teacher!Halloween Candy Computer Graphing includes the following activities:Sort and counti pictures of different Halloween candies Complete a tally marks sheet with the data and convert tally marks into numbersEnter data into a pre-formatted Excel or
Grades:
PreK - 2nd
Types:
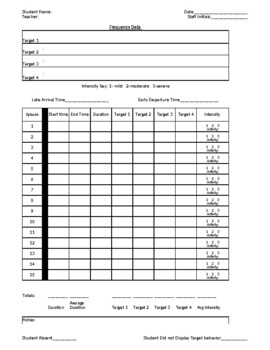
Behavior Frequency Rate Chart w/ Target, Intensity, Duration, BIP chart/Summary
Behavior Frequency Rate Chart (dates and chart cant be edited and dates changed to current year or target)--Daily Sheet-Date Entry-Intensity Chart-Duration Chart-Target Charts-BIP Evaluation printout -BIP write upSee preview for description Excel format for editing - tabs at bottom of page for easy change of view and data entry
Subjects:
Grades:
PreK - 12th
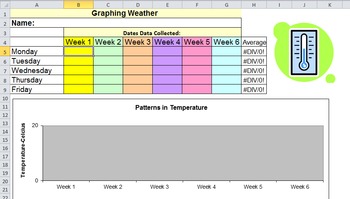
Weather Graph
This Excel spreadsheet can be used as a whole group activity, or as an individual activity. Students enter daily temperature. The sheet automatically graphs the data. There are seven sheets. One sheet is for data collected daily over six weeks. The other sheets are from collecting data each day on a monthly basis. The monthly sheets are automatically set to average the weekly temperature. Some cells are locked to prevent younger students from accidently deleting labels, etc. Each sheet can be pr
Subjects:
Grades:
K - 7th
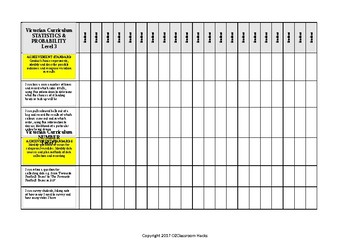
Mathematics STATISTIC PROBABILITY Checklist Level 3 Victorian Curriculum 'I Can'
Level 3 Statistics and Probability Checklist aligned with the Victorian Curriculum. Fed up with recreating new checklists - ME TOO! Hope this helps. Here is a checklist completely aligned with the Victorian Curriculum. All put simply in 'I Can' statements as YOU WOULD TEACH IT!
MAKE LIFE SIMPLE! Teaching is time consuming enough.
Subjects:
Grades:
PreK - 6th
Types:
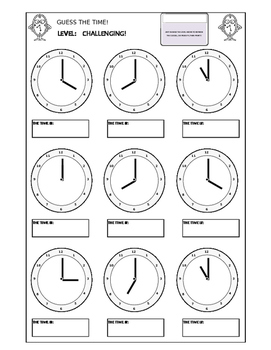
Clocks - Guess The Time
An easy way to produce hundreds of clock worksheets so that your students can practice working out the time. This is an Excel worksheet with 9 clocks, that refresh randomly to produce any number of random print outs.
There are three levels (Challenging, Really Hard, and Nightmarish!), corresponding to Easy (K, G1), Medium (G2, G3) and Hard (G4, G5). You only have to change levels or refresh the page (F9 for a PC) and you have a new sheet.
Tab 1 ("GUESS") is for guessing the time from a clock.
Subjects:
Grades:
K - 7th
Types:
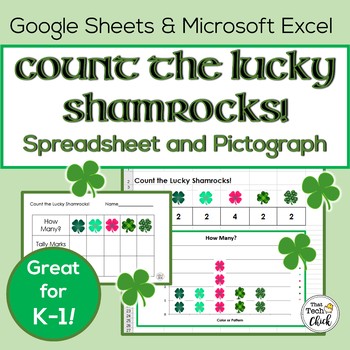
Computer Graphing for K-1 - Count the Lucky Shamrocks!
This graphing activity is a great way to differentiate and meet the needs of all your students as they count and sort five different shamrocks into groups and record their numbers on tally sheets. When the data is entered in their spreadsheet, a cute pictograph is automatically generated!Not only does the technology ''up" the level of your instruction, it can be easily differentiated. Students who might need additional support can be given fewer types of pictures to sort and/or count, while m
Grades:
PreK - 2nd
Types:
CCSS:
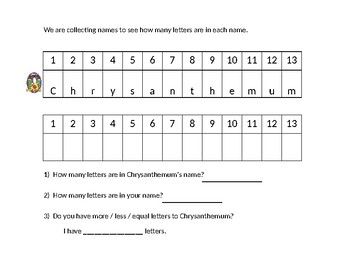
Chrysanthemum: Graphing Your Name
Students will compare their name to Chrysanthemum.
Subjects:
Grades:
PreK - 2nd
Types:
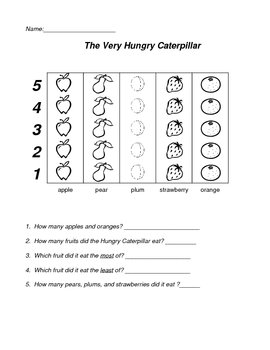
The Very Hungry Caterpillar Graphing Activity
After reading, "The Very Hungry Caterpillar", this can be used as a math extension. It is a graphing exercise based on the story.
Grades:
K - 2nd
Types:
IEP Behavior Calculation
This template is a one stop shop. Insert your data and the rest is done for you. In this template you have the entire year month by month. Each month has 5 behaviors that you can calculate. Once you enter your numbers, the template will calculate the total and average, for each behavior, for that entire month. Once your month is filled out, you will go to the graph page where all your data will be graphed out for you.
Grades:
PreK - 12th, Higher Education, Adult Education
Types:

Favorite Thanksgivng Food
This is an excel spreadsheet activity.
It can be done as a whole class or in groups.
Students take a poll on who likes what Thanksgiving foods, as the number is put in beside the word and picture it graphs the answers. Not only do you get a chart with the favorite Thanksgiving foods you also get a graph that corresponds to the graph.
Subjects:
Grades:
PreK - 4th
Beginning of the Year Graphing
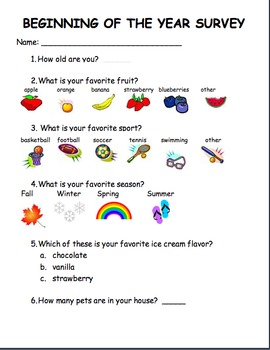
This is a fun beginning of the year activity. It gets the kids to work together in small groups and introduces the concept of graphing. Included is a survey sheet for students to fill out themselves, then the group records results together. Once all of the student results are in, the class can be divided into groups to color in the bar graphs using the data.
*Survey includes first grade ages, but could be modified for K or 2nd.
Subjects:
Grades:
K - 2nd
Types:
Microsoft Excel Spring Math & Vocabulary Activities
These activities are for students with no prior experience using Microsoft Excel. Spring themed lessons to introduce younger students to using Microsoft Excel. Aligned with Common Core, students will count, graph, answer more or less questions, and either add the numbers manually or by using the AutoSum Function in Microsoft Excel. It is your choice! There are separate directions to teach students how to use the AutoSum Function in Microsoft Excel if you choose. Each spreadsheet has different da
Subjects:
Grades:
K - 2nd
Types:
Weather Watcher's Monthly Bar Graph
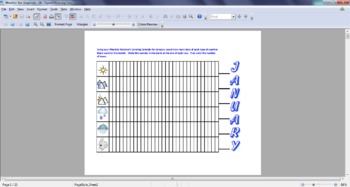
After collecting data for the month on the Weather Watcher's Coloring Calendar, use this blank chart for analyzing the amount of each type of weather experienced in that month. This chart features colorful, easy to identify symbols for basic types of weather and clear instructions. All 12 months included in this package.
Subjects:
Grades:
K - 3rd

Winter Computer Activities Excel & PowerPoint
No Prep - Ready to Go Winter Computer Activities for K-2Activity 1 - Students will use the Fill Color in Excel to create a graph (spreadsheet file included to share) of Winter things from a PDF handout. Colored Text is on the PDF directions sheets for students in kindergarten who cannot read all color words yet. Activity 2 - Students will change text color, type beginning letter from picture words, arrange items from smallest to largest and largest to smallest, count by 10s, count "I Spy" Winter
Grades:
K - 2nd
Types:
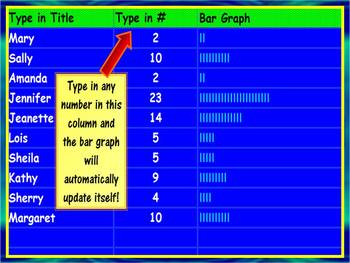
Automatic Bar Graph Maker
This activity can be used to teach students of all ages about bar graphs. This spreadsheet can be used to introduce the concept of bar graphs to elementary students as well as implemeted by mid-level & high school students in lab reports and/or presentations. It is extremely quick and easy to use! Just type in a set of numbers and it automatically creates a simple bar graph. And check out my other graph templates for line and bar graphs! They are definately worth your time!
Grades:
K - 12th
Types:
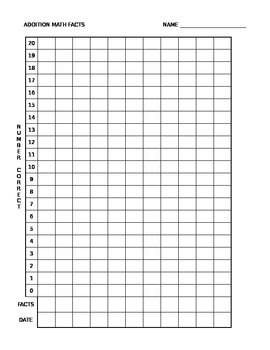
Addition Facts - Chart of Progress for Student *Editable!
This is a great little graph your students can use to chart their progress with their math facts. I have left this as an excel spreadsheet so that you can edit it as needed. The graph includes a place for the date, type of math fact (+1, +2, etc), number of facts completed, and room for your student to color in how many facts they completed for the day. Students really love seeing the progress they make! Great to use at conferences or to turn in as artifacts for your professional development
Subjects:
Grades:
K - 3rd
Types:
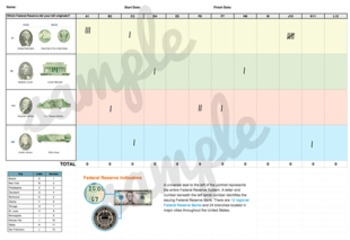
Which Federal Reserve Did My Bill Come From?
A tally sheet that is a great pre-cursor to any field trip or discussion on the Federal Reserve. Kiddos can learn how to identify which reserve the bill in thier wallet/purse comes from and over a period of time (determined by you), can tally where the bills are from that they and their parents use for transactions. Great project for students learning about money or economics!Comes as an Excel document, but you can export that into a PDF to print for your student where they can complete with a
Subjects:
Grades:
K - 12th
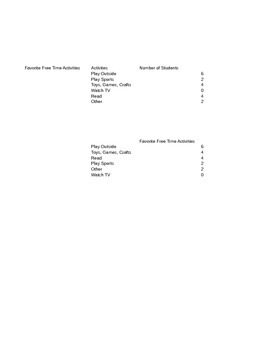
Favorite Hobby/Free Time Real-Time Interactive Bar and Pie Graph
Take a live poll and show your students how the data input changes the bar and pie graph. Easily modified to fit many classrooms by simply changing the names of the hobbies or change the topic altogether.
Subjects:
Grades:
K - 3rd
Student Sticker Reward Chart
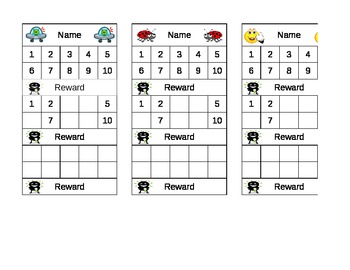
This sticker chart is constructed to help teachers as well as students. It has 30 blocks that hold the small stickers usually bought in a pack. After 10 stickers, children receive an award. There are numbers 1-10 in the first set, some are omitted in the second set, and all are eliminated in the third. This will help children with number identification and simple math ("how many more do you need"). Teachers do not have to worry about making new sticker charts every time a child gets rewarded and
Grades:
PreK - 5th
Types:
Math Meeting Calendar
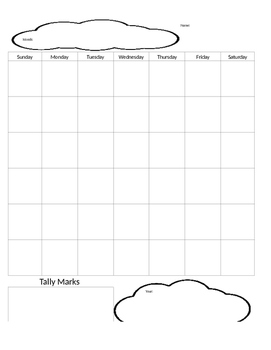
Math Meeting Calendar was developed to accompany Saxon's Math Meeting. Sheet 1 Includes:* Month (left empty for practice writing and spelling)*Calendar (left empty for the student to write in the date, 6 rows for the long months)* Tally Marks (for the number of days in the month)* Year (left empty for practice in writing the year)Sheet 2 includes:* Weather Graph (for graphing practice)* Cups (to count coins and practice writing in cents)* Monthly Calendar Pattern (to draw the shape pattern for t
Subjects:
Grades:
PreK - 1st
Types:
Subtraction Facts - Chart of Progress for Students *Editable!
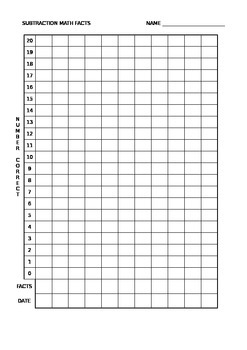
This is a great little graph your students can use to chart their progress with their math facts. I have left this as an excel spreadsheet so that you can edit it as needed. The graph includes a place for the date, type of math fact (-1, -2, etc), number of facts completed, and room for your student to color in how many facts they completed for the day. Students really love seeing the progress they make! Great to use at conferences or to turn in as artifacts for your professional development por
Subjects:
Grades:
K - 3rd
Types:
Graphing Flavors of Popcorn
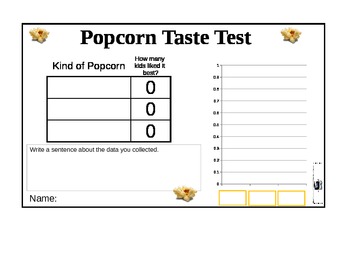
This is an Excel spreadsheet designed for use with first graders. Students sample 3 types of popcorn (butter & salt, chocolate, and candied popcorn), then a class vote is done. Students move the labels onto the data chart and graph. There is space for students to type in the votes and a sentence about their data.
Grades:
K - 1st
Showing 1-24 of 40 results


