29 results
Higher education Common Core 6.SP.A.1 resources
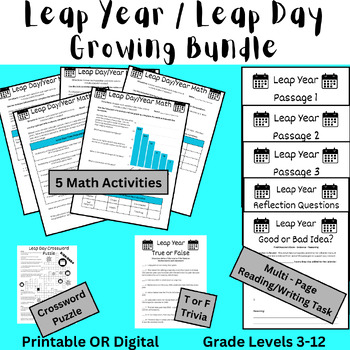
Leap Year (Leap Day) 2024 Bundle - Math, Reading, Writing, and Trivia
This bundle contains several fun and NO PREP activities to use to celebrate Leap Day 2024 (Leap Year 2024). Many contain a customizable digital resource (Google Document) and a printable resource (Canva) that contain the same directions and activity. These activities were designed for students in middle school, but could be used for upper elementary and high school students in Pre Algebra, Pre-Algebra, or Algebra.For more details on each product, click on the individual product to see the previe
Subjects:
Grades:
4th - 10th, Higher Education, Adult Education
Types:
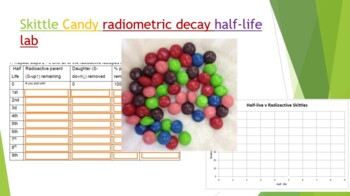
Skittle Radiometric Decay Half-life Lab
Did you know you can use Skittles candy to demonstrate absolute dating and radiometric decay! Buy a 1-4 lb bag at your local bulk warehouse store for savings. This lab is a great way to show how isotopes decay by shaking a plate full of random skittles. Students use Skittles to observe "Isotopes" decay over each half life. At the end of the lab (and only IF they have done all their work) they can enjoy their "daughter products". Skittles were used because they are durable, hypoallergenic, and th
Subjects:
Grades:
8th - 12th, Higher Education, Adult Education
Types:
NGSS:
HS-PS1-8
, HS-PS1-1
, HS-PS1-4
, HS-PS1-6
, MS-PS1-4
...
Also included in: Hands-on Science Semester Labs Bundle
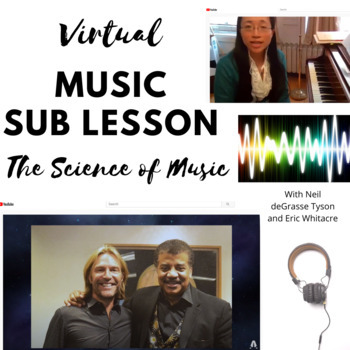
NEW Digital Learning Music Sub Plan: The Hidden Science of Music
All NEW Online Learning SUB PLAN: The Hidden Science of Music with Neil deGrasse Tyson sits down with Grammy-award winning composer Eric Whitacre to explore the hidden science of music- perfect for any music classes, choirs or music general learning classes that are being taught online for distance learning.Music Sub Plans for Online Learning can be modified from its 90 minute length to be a 45-90 minute lesson, depending on grade level. Music, subject matter and lesson is appropriate for 4-12th
Subjects:
Grades:
5th - 12th, Higher Education, Adult Education
Types:
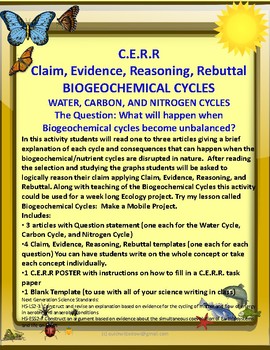
Nutrient Cycles
C.E.R.R Claim, Evidence, Reasoning, Rebuttal
BIOGEOCHEMICAL CYCLES: WATER, CARBON, AND NITROGEN CYCLES
The Question: What will happen when Biogeochemical cycles become unbalanced?
In this activity students will read one to three articles giving a brief explanation of each cycle and consequences that can happen when the biogeochemical/nutrient cycles are disrupted in nature. After reading the selection and studying the graphs students will be asked to logically reason their claim applying Claim
Subjects:
Grades:
6th - 12th, Higher Education, Adult Education
Types:
CCSS:
Also included in: Ecology Unit Bundle: TOP SELLER
NYS State Math Test Review Packet: 6th Grade
Aligned with the NYS State Math Test mathematics review sheet. Colorful, kid-friendly way to remind students to baseline at the beginning of the year or to review a full year of 6th grade skills and standards. Includes both straight computation and word problems. Can be used in gifted and talented programs as well or for enrichment for advanced learners or as skill review in HS basic skills or adult education programs in preparation for TASC or GED test.Intervention / MTSS / RTI / AIS / Special
Subjects:
Grades:
3rd - 12th, Higher Education, Adult Education, Staff
Types:
GED Math - Intermediate Problems - 8 Weeks
Your students already know how to work with fractions, decimals, percents, and a calculator. Now get them to the next level. Give them these problem sets to help them pass the GED or HiSET Math tests in 6 to 9 weeks.Use These Problem Sets To:Have students work through up to 9 weeks of problem sets in class, for 3 to 6 hours per week.Teach a variety math topics that are key for college and career readiness, and for passing the GED/HiSET math tests, including: word problems, expressions, equations
Subjects:
Grades:
6th - 12th, Higher Education, Adult Education, Staff

Math Homework Packets Middle School/Jr High (6-9)
Math Homework Packets Middle School/Jr High (6-9)
It contains 18 Homework.
It is 21 pages about the following topics:
Order of Operations (15 questions)
Digital Roots (9 questions)
DIVISIBILITY RULES (25 questions)
Metric Conversions (16 questions)
Adding and Subtracting Unit Fractions (48 questions)
Scientific Notation (22 questions)
Converting Decimals to Fractions (42 questions)
Percent & Equation (18 questions)
Solving One and Two Step Equations (40 questions)
Translating W
Subjects:
Grades:
6th - 10th, Higher Education, Adult Education
Types:
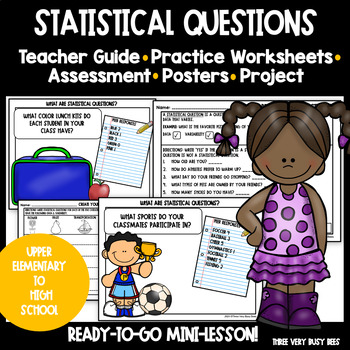
Statistical Questions Mini-Lesson with In-Class Project
Statistical QuestionsUse this mini-lesson to teach your students the difference between a statistical question and a regular question.Students will know statistical questions have:datavariabilityThis resource is a mini-lesson designed to be completed in one week; however, you can take as much or as little time as you like!What’s included:✅Teacher Guide & Example Poster✅3 Posters with Statistical Questions and Images ✅What Are Statistical Questions worksheet✅Find the Variability & Data wo
Subjects:
Grades:
6th - 10th, Higher Education
Types:
CCSS:
6th Grade Math Video Lesson Full Year BUNDLE *Distance/Flipped/Remote/Online*
6th Grade Math Video Lessons are ready to go and I am excited to offer them to you and your students in this FULL YEAR VIDEO LESSON BUNDLE. Are you considering Flipped Learning this coming year? Will students be learning virtually and you want them to have access to video lessons they can refer to for extra help? Do you plan on having your student’s home-schooled this coming year and you want them to get the same instruction they would if they were attending an in-person classroom? Teachers, do
Subjects:
Grades:
4th - 8th, Higher Education, Adult Education, Staff
Types:
Skittle Statistics MS Excel Mini-Lab
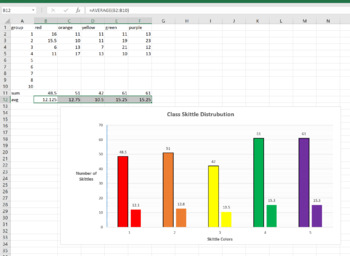
This is a 1 class MS Excel lab for a computer or math class. You can have the students explore the distribution of different color Skittles in class. This is a great mini-lab or half-day activity when you school ends up with a weird schedule day. Tell them they can't eat till the Skittles till the end of class, or they will distort their numbers. Also make sure they don't throw them or shove them up their nose (Yes, stuck Skittles are hard to extract, ask me how I know..)The goal of this lab is
Grades:
6th - 12th, Higher Education, Adult Education
Types:
NGSS:
MS-ETS1-2
, HS-ETS1-2
, HS-ETS1-3
, MS-ETS1-4
, MS-ETS1-1
...
Also included in: Hands-on Science Semester Labs Bundle
Create - a - Creature Genetics Unit
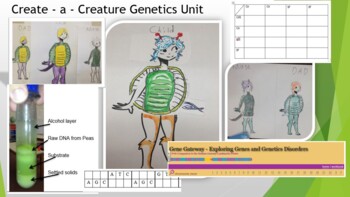
This whole unit covers the basics of genetics! It includes the Create a Creature lab, home genetic test, Punnet Squares, webquest, and final test!You can also extract DNA from dried peas; practice reading DNA and RNA; explore genetic disorders through the Human Genome Project webquest; and explore pedigree charts! You will have to create your own shell and tail pieces this. The original artist has gone on to draw a Google doodle ! You can also have the students design their own shell / tails. Th
Subjects:
Grades:
7th - 12th, Higher Education, Adult Education
Types:
NGSS:
HS-LS3-3
, HS-LS3-1
, MS-LS4-3
, MS-LS4-1
, HS-LS4-2
...
Also included in: Hands-on Science Semester Labs Bundle
Game Templates Bundle
This Bundle includes Templates to create your own games! You can use this for any subject, any grade level! This is a great investment since you can use the templates over and over again!Game Templates included are:Connect 4MonopolyScrabblePac-man Race If you ever need any help with any of the templates and creating your own games with them, please reach out to us! We are happy to help!contact@middlemathenthusiast.com
Subjects:
Grades:
PreK - 12th, Higher Education, Adult Education, Staff
Types:
NGSS:
MS-ESS3-2
, MS-ESS3-1
, MS-ESS3-5
, MS-ESS3-4
, MS-ESS3-3
6 Editable Bar Graph Templates 2.0
Finally a simple and professional graph space that students can fill out without any design issues getting in the way. This file contains 6 ready-to-use graph options. Print them and have students fill them with pencil and ruler, or distribute them over computer and let them practice entering the data. Get a project perfect finish every time. Maybe you just want to fill it out live on a projector? The possibilities are endless! It's okay to say you love these bar graphs. So do we.Contains:- 2 bl
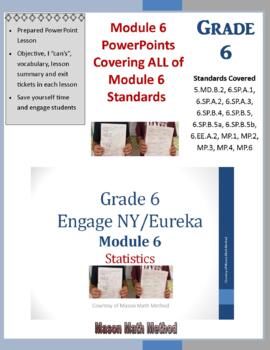
6th Math Module 6 Topics A-D PowerPoint Package on Statistics
This download contains 6th grade math Module 6 Topic A-D Lessons 1-19 PowerPoint Lessons inspired from the Engage NY Eureka Math program, and self-made using other various resources (Total 1,208 slides). Topic A covers the following: Statistical questions, categorical/numerical data, displaying a data distribution, creating a dot plot, and review histograms.Topic B mainly covers the following: MAD (Mean absolute deviation)Topic C covers the following: Mean, Median, Mode, Range, Stem-and-Leaf P
Subjects:
Grades:
4th - 7th, Higher Education, Adult Education, Staff
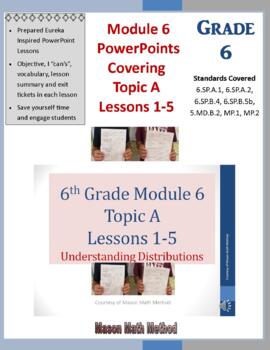
6th Math Module 6 Topic A Lessons 1-5 Understanding Distribution PowerPoint
This download contains 6th grade math Module 6 Topic A Lessons 1-5 PowerPoint Lessons from the Engage NY Eureka Math program, and self-made using other various resources (Total 247 slides). Topic A covers the following: Statistical questions, categorical/numerical data, displaying a data distribution, creating a dot plot, and review histograms. I created/put these PowerPoint lessons together to help me lead my lessons and make sure I covered all the things required such as objective, I “can” st
Subjects:
Grades:
4th - 7th, Higher Education, Adult Education, Staff
Also included in: 6th Math Module 6 Topics A-D PowerPoint Package on Statistics
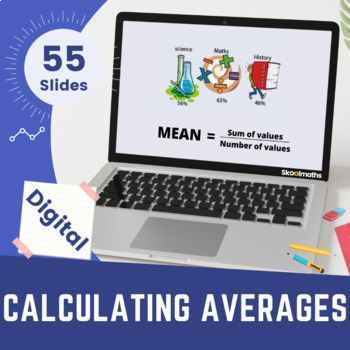
Mean Median Mode and Range Digital Activities
Find the mean, median, mode, and range of a set of data. The mean is just what it sounds like - the average of all the numbers. We need to know this because it tells us how much an amount changes. The mode is the number that appears most often in a set of data. We have the median which tells us where half the values in the data are less than or greater than that number. Lastly, the range of a set of numbers is the difference between the smallest number and the largest number in the set. Find out
Subjects:
Grades:
6th, Higher Education
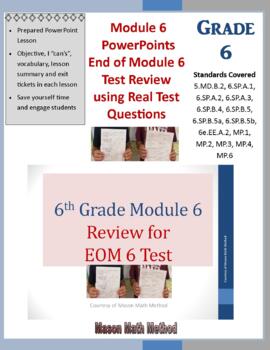
6th Math End of Module 6 Test Review PowerPoint Statistics
This download contains 6th grade math End of Module 6 Review PowerPoint Lessons inspired from the Engage NY Eureka Math program. The topics reviewed include the following: Statistical Questions, Numerical vs. Categorical Data, Mean, Median, Mode, Range, IQR, Stem-and-Leaf plots, Box and whisker plots, dot plots, frequency tables, and histograms. These are self-made using other various resources in combination with Eureka inspired lessons from Module 6. (Total 120 slides). I created/put these Po
Subjects:
Grades:
4th - 7th, Higher Education, Adult Education, Staff
Also included in: 6th Math Module 6 Topics A-D PowerPoint Package on Statistics
Data Foldable and Bulletin Board Trim
Directions:Bulletin Board: Print the completed terms and use for a classroom bulletin board. Cut each page into 2 terms for maximum coverage on your bulletin board.Foldable: Print the incomplete terms and hand to students. Students cut along dashed line, stack and staple along the edge. Students can then define and provide examples taken from class or at home review.Targeted Purpose or Skills:1. Engaging learning environment2. Terminology introductionTargeted Topics1. Data
Subjects:
Grades:
9th - 12th, Higher Education, Adult Education
6th Math Module 6 Lesson 2 Displaying Data Distributions PowerPoint Lesson
This download contains 6th grade math Module 6 Topic A Lessons 2 PowerPoint Lesson from the Engage NY Eureka Math program, and self-made using other various resources (Total 64 slides). Lesson 2 covers the following: Displaying Data Distributions I created/put this PowerPoint lesson together to help me lead my lessons and make sure I covered all the things required such as objective, I “can” statements, vocabulary, lesson summary and exit ticket. Each lesson I pulled out what I felt I needed o
Subjects:
Grades:
4th - 7th, Higher Education, Adult Education, Staff
6th Math Mod 6 Lesson 1 Statistical Questions & Categorical/Numerical Data Power
This download contains 6th grade math Module 6 Topic A Lessons 1-5 PowerPoint Lessons from the Engage NY Eureka Math program, and self-made using other various resources (Total 65 slides). Topic A Lesson 1 covers the following: Statistical questions and categorical/numerical data. I created/put this PowerPoint lesson together to help me lead my lesson and make sure I covered all the things required such as objective, I “can” statements, vocabulary, lesson summary and exit ticket. Each lesson I
Subjects:
Grades:
4th - 7th, Higher Education, Adult Education, Staff
6th Math Module 6 Lesson 3 Creating a Dot Plot PowerPoint Lesson
This download contains 6th grade math Module 6 Topic A 3 PowerPoint Lesson from the Engage NY Eureka Math program, and self-made using other various resources (Total 63 slides). Lesson 3 covers the following: Creating a Dot Plot. I created/put this PowerPoint lesson together to help me lead my lessons and make sure I covered all the things required such as objective, I “can” statements, vocabulary, lesson summary and exit ticket. Each lesson I pulled out what I felt I needed or could use in the
Subjects:
Grades:
4th - 7th, Higher Education, Adult Education, Staff
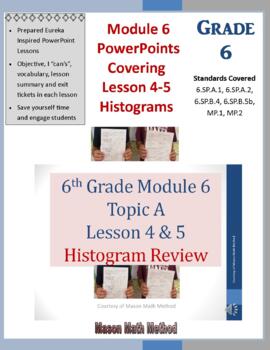
6th Math Module 6 Topic A Lesson 4-5 Histogram PowerPoint Lesson
This download contains 6th grade math Module 6 Topic A Lesson 4-5 Combo PowerPoint Lesson Inspired from the Engage NY Eureka Math program, but completely self-made using other various resources (Total 55 slides). Lesson 4-5 covers the following: HistogramsI created/put this PowerPoint lesson using only outside resources. This PowerPoint lesson reviews Histograms and I made sure all the things required such as objective, I “can” statements, vocabulary, lesson summary and exit ticket are covered.
Subjects:
Grades:
4th - 7th, Higher Education, Adult Education, Staff
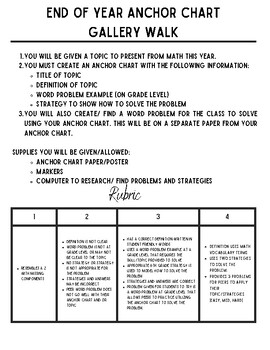
End of Year Anchor Chart Gallery Walk Project
Need some end of year project ideas?Give your students a turn to show what they learned this year. You have been creating anchor charts all year for your students to grasp the math concepts you have taught. It's their turn to show their understanding. Assign them or have them draw a topic that was taught in your class this year and provide them this instruction sheet and rubric to begin making their anchor chart. Give them a chance to be the teacher!! You will be excited to see how much they lea
Passion-Driven Statistics E-book (Introductory/AP Statistics Course Textbook)
Passion-Driven Statistics is an NSF-funded, multidisciplinary, project-based curriculum that supports students in conducting data-driven research, asking original questions, and communicating methods and results using the language of statistics. The curriculum supports students to work with existing data covering psychology, health, earth science, government, business, education, biology, ecology and more. From existing data, students are able to pose questions of personal interest and then use
Subjects:
Grades:
6th - 12th, Higher Education, Adult Education
Types:
Showing 1-24 of 29 results

