221 results
Statistics Common Core 8.SP.A.3 resources
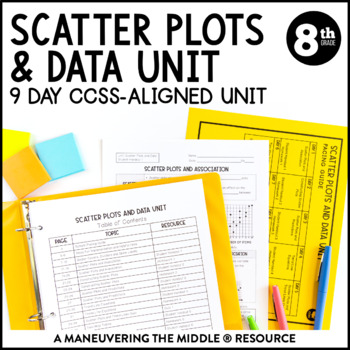
Scatter Plots and Data Unit | 8th Grade Math | Line of Best Fit Notes
A 9 day CCSS-Aligned Scatter Plots and Data Unit - including scatter plots, trend lines, two-way tables and relative frequency.Students will practice with both skill-based problems, real-world application questions, and error analysis to support higher level thinking skills. You can reach your students and teach the standards without all of the prep and stress of creating materials!Standards: 8.SP.1, 8.SP.2, 8.SP.3, 8.SP.4; Texas Teacher? Grab the TEKS-Aligned Scatter Plots and Data Unit. Please
Subjects:
Grades:
8th
Types:
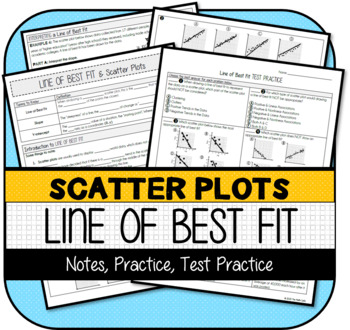
Scatter Plots: Line of Best Fit NOTES & PRACTICE
This resource contains the following items:1) Introduction to Line of Best Fit NOTES & PRACTICE2) Interpreting Line of Best Fit NOTES & PRACTICE3) Line of Best Fit TEST PRACTICE --8 Multiple Choice Questions --Printable --Version for Google Forms (auto-graded)4) Answer Keys to All PartsThis resource was developed to meet the requirements of the 8th Grade Statistics & Probability standards below:CCSS.MATH.CONTENT.8.SP.A.2 Know that straight lines are widely used to model
Subjects:
Grades:
7th - 9th
Also included in: Scatter Plots MINI-BUNDLE
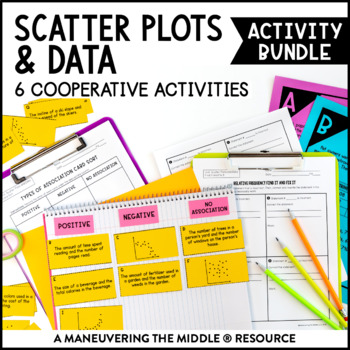
Scatter Plots and Data Activity Bundle | Trend Lines Activities for 8th Grade
This Scatter Plots and Data Activity Bundle includes 6 classroom activities to support 8th grade scatter plots and two-way tables. These hands-on and engaging activities are all easy to prep! Students are able to practice and apply concepts with these scatter plots and two-way table activities, while collaborating and having fun! Math can be fun and interactive!Standards: CCSS (8.SP.1, 8.SP.2, 8.SP.3, 8.SP.4) and TEKS (8.5C, 8.5D, 8.11A)More details on what is included:Six hands-on activities t
Subjects:
Grades:
8th
Types:
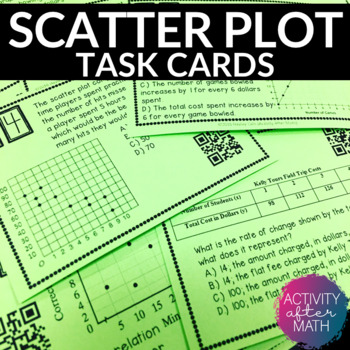
Scatter Plots and Line of Best Fit Task Cards with QR Codes
Get your students involved with practicing Interpreting Data with Scatter Plots and Line of Best Fit! Task cards include multiple choice problems and constructed response. Click here to SAVE and get this as a Task Cards BUNDLEThis resource includes:Teacher InstructionsTeacher TipsStudent Instructions24 Task cards with QR codes24 Task cards without QR codesBlank Answer Document for studentsAnswer Key for easy gradingOptions for using this resource:You can print the ones with QR codes for students
Subjects:
Grades:
8th - 9th
Types:
Also included in: 8th Grade MATH TASK CARDS BUNDLE
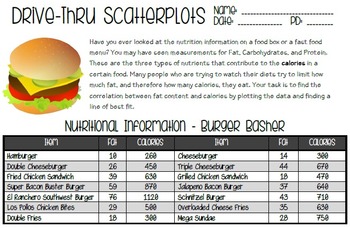
Drivethru Scatter Plots - Line of Best Fit Activity
This activity is a fun way to work with scatter plots in a realistic situation. Students will compare the fat and calories in items from a fictional fast food restaurant by creating a scatter plot. They will also draw a line of best fit, approximate the slope of that line, and make predictions based on the line.
Included:
*Drive-Thru Scatterplots Activity
*Answer Key
Please leave feedback with any suggestions for improvements! :)
Subjects:
Grades:
8th - 9th
Types:
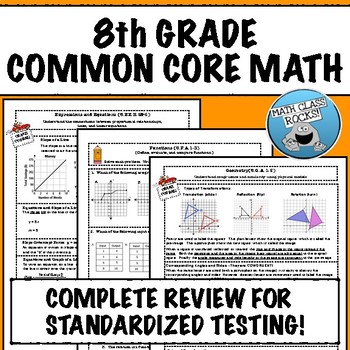
8TH GRADE MATH COMMON CORE REVIEW
If you need to prepare your students for a standardized test based on the Common Core, this “crash course” is exactly what you need! Organized by standard and easy to use, just print and let the reviewing begin! What's Included?This download consists of 10 “crash course” reviews with explanations and examples. Every "crash course" is followed by a practice assessment comprised of items aligned with standardized state tests. The Number SystemKnow that there are numbers that are not rational, a
Subjects:
Grades:
7th - 9th
Types:

Oscar Winner -- Data Analysis & Statistics Inquiry - 21st Century Math Project
Utilize the last twenty years of Oscar winners as a data set to guide your students through creating box and whisker plots, histograms, and exploring mean, median, and mode -- in one 21st Century Math Project!Does the age of the award winning star in a film relate to the overall gross of the movie? Student will explore this inquiry question and use the data to support their conclusion.In this 8 page document you will be given a mapping to the Content Standards, an outline for how to implement t
Subjects:
Grades:
6th - 12th
Types:
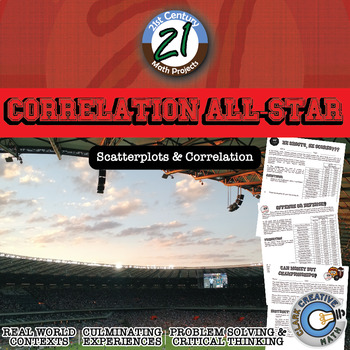
Correlation All-Star -- Sports Data Analysis - 21st Century Math Project
Bring an authentic sports-based math project to your Algebra, Algebra 2 or PreCalculus classroom with Lines of Best Fit and Correlations! All in this 21st Century Math Project! Using data from the MLB, NBA, NFL and NHL students investigate correlations to some of sports most common questions like: "Do more shots result in more goals?" "Do hitters or pitchers have more impact on a team's wins?""What NFL stat is most strongly correlated with wins?" and the grand-daddy..."Can money buy championship
Subjects:
Grades:
7th - 12th
Types:
CCSS:
Scatter Plots Statistics Worksheet 8.SP.A.1
Hello, Amazing Educators! Ready to transform scatter plots from a math challenge to a thrilling adventure? Our Interactive Scatter Plot Worksheet is here to make learning a breeze and turn your classroom into a hub of critical thinking and problem-solving excitement! Why Choose Our Interactive Worksheet? Engaging and Interactive: Say goodbye to dull lessons! This two-sided worksheet is packed with interactive elements that keep students hooked. From constructing and interpreting scatter plots to
Subjects:
Grades:
8th
Types:
CCSS:
Also included in: Scatterplots Two Way Tables and Residual Plots Worksheets Bundle
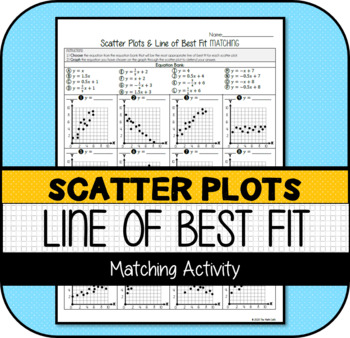
Scatter Plots: Line of Best Fit MATCHING Activity
This resource was developed to partially meet the requirements of the 8th Grade Statistics & Probability standards below (portions met in bold):CCSS.MATH.CONTENT.8.SP.A.2Know that straight lines are widely used to model relationships between two quantitative variables. For scatter plots that suggest a linear association, informally fit a straight line, and informally assess the model fit by judging the closeness of the data points to the line.CCSS.MATH.CONTENT.8.SP.A.3Use the equation of a l
Subjects:
Grades:
7th - 9th
Types:
Also included in: Scatter Plots MINI-BUNDLE
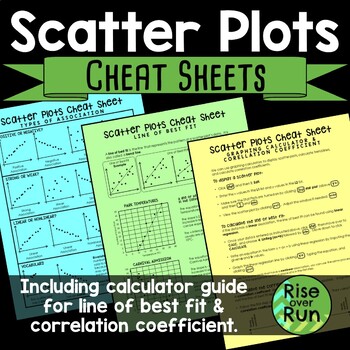
Scatter Plot Cheat Sheets Printable Guided Notes
Detailed sheets for the following topics: •Types of Association & VocabularyThis page shows examples of positive, negative, strong, weak, linear, and nonlinear association. It also shows clusters and outliers.•Line of Best FitThis page explains what a line of best is (or trend line) along with examples and nonexamples. It has 2 real world connections and how to interpret the line of best fit.•Graphing Calculator Guide & Correlation CoefficientThis sheet gives step by step instructions fo
Subjects:
Grades:
8th - 9th
CCSS:
Also included in: 8th Grade Math Activities & Lessons Bundle for the Whole Year
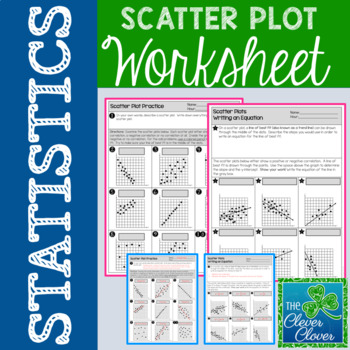
Scatter Plot Worksheet
Scatter Plot Worksheet
This resource allows students to explore scatterplots with a two page worksheet. Students are asked to define scatterplots in their own words. Nine questions ask students to identify the type of correlation (positive, negative or no correlation) that exists between two variables. Students are also asked to describe the steps used to write an equation for the line of best fit. Six additional questions require students to calculate the slope and determine the y-intercept
Subjects:
Grades:
6th - 9th, Adult Education
Types:
CCSS:
Also included in: Scatter Plot Mini-Bundle
Scatter Plots & Two-Way Tables UNIT BUNDLE
This bundle contains:1) Notes with Practice Problems2) Test Practice 3) Supplementary Activities4) Quizzes (with options for Google Forms)5) Review Task Cards 6) Unit Test (with option for Google Forms)This resource was developed to meet the requirements of the 8th Grade Statistics & Probability Standards below:CCSS.MATH.CONTENT.8.SP.A.1 Construct and interpret scatter plots for bivariate measurement data to investigate patterns of association between two quantities. Describe patterns such a
Subjects:
Grades:
7th - 9th
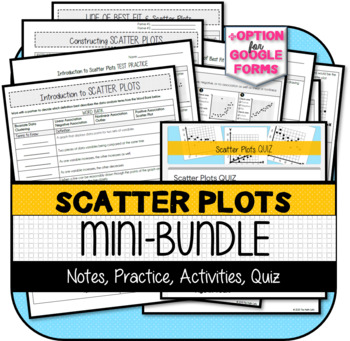
Scatter Plots MINI-BUNDLE
This resource contains the following items:1) Notes with Practice Problems2) Activities (Constructing Scatter Plots & Matching Line of Best Fit)3) Test Practice4) Quiz5) Answer KeysThis resource was developed to meet the requirements of the 8th Grade Statistics & Probability Standards below:CCSS.MATH.CONTENT.8.SP.A.1 Construct and interpret scatter plots for bivariate measurement data to investigate patterns of association between two quantities. Describe patterns such as clustering, out
Subjects:
Grades:
7th - 9th
Types:
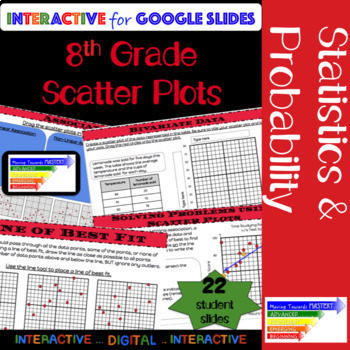
8th Grade Math Scatter Plot: Guided Interactive Lesson
Extensive ALL digital guided lesson for constructing and interpreting scatter plots.The slides are scaffolded to build understanding. Students will progress from identification of terms to making predictions involving bivariate data. The guided slides will begin with identification, move towards assisted analysis, and conclude with independent practice.Slides include...♦ Definitions and Visual Representations♦ Identification and Use of Terms→ Bivariate Data→ Scatter Plot→ Linear, Nonlinear, &
Subjects:
Grades:
8th - 10th
Types:
CCSS:
Also included in: 8th Grade Math Common Core Growing Bundle
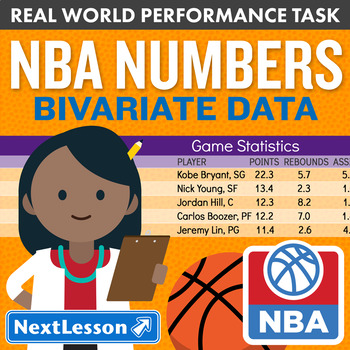
Bundle G8 Bivariate Data / Scatterplots - NBA Numbers Performance Task
Bundle of 29 editions of NBA Numbers Performance Task for 8th grade
In the NBA Numbers Performance Task, students use real data on the players in their favorite basketball team to practice interpreting a scatter plot and finding the equation for the line of best fit, and to extend into constructing a scatter plot from a set of data in an engaging, real world context. Students take on the role of a statistical analyst for the team and determine which player statistics are related to help make im
Subjects:
Grades:
8th
Types:
8th Grade Math End of Year Review Digital Self-Checking Activity Bundle
This bundle of 5 engaging digital activities will provide your 8th grade math students with instant feedback as they solve problems related to all CCSS Grade 8 Math standards.This self-checking, auto-grading Google Sheets activity is just what you need for:Test Prep for Standardized AssessmentsWrapping up at the end of the Data unitReviewing all learning for grade 8 concepts and skills at the end of the school yearStudents will answer each problem by typing their answer in the appropriate space
Subjects:
Grades:
8th
Types:
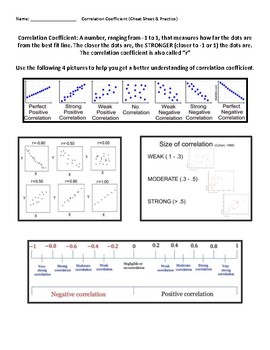
Correlation Coefficient (Cheat Sheet & Notes)
This resource can be used as a self-directed worksheets where students use the cheat sheet to access the 8 practice problems. I typically use this as an extention for 8th graders during the scatter plots unit, or for 9th graders. An answer key is provided. Enjoy!
Subjects:
Grades:
8th
CCSS:
Also included in: Scatterplots Bundle (Weeks of Products!)
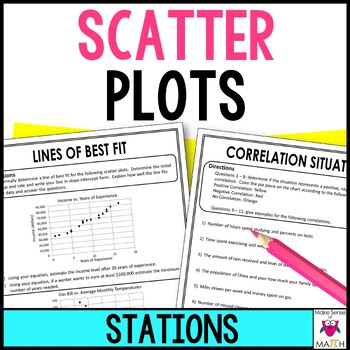
Scatter Plots Stations Activity | Lines of Best Fit, Correlation & Analyze
These math stations delve into scatter plots with a focus on correlation and informally analyzing lines of best fit. Students will create, analyze, estimate and explain. Students will develop a deep understanding of this content after completing these math stations. The following stations are included:Create and Analyze: Students will create and analyze a scatter plot. Noticing correlation, outliers and clusters. Lines of Best Fit: Students are given a scatter plot and are to informally dra
Subjects:
Grades:
8th - 9th
Types:
Also included in: Middle School Math Stations Bundle | Math Centers
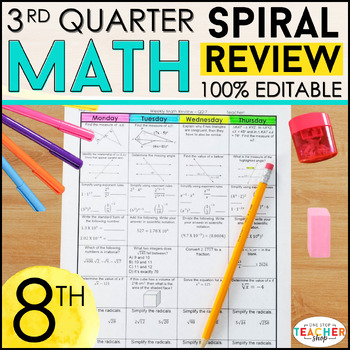
8th Grade Math Review & Quizzes | Homework or Warm Ups | 3rd QUARTER
This 8th Grade math spiral review resource can easily be used as math HOMEWORK, WARM UPS, or a DAILY MATH REVIEW! This resource was designed to keep math concepts fresh all year and to help you easily track student progress. All pages are 100% EDITABLE and easy to differentiate to fit your students' needs.Get the ENTIRE YEAR BUNDLE! {CLICK HERE} ☝☝ Check out the Preview for more details and 3 FREE Weeks! ☝☝This Spiral Review System is also available for LANGUAGE (Grammar & Word Study)Go 100%
Subjects:
Grades:
8th
Types:
Statistics & Probability Common Core Unit {grade 8}
Statistics and Probability unit for grade 8 includes: interactive notebook pages, enter/exit tickets, task cards, activities, worksheets and assessments to teach the following 8th grade math standards:
8.SP.1 - Scatter plots
8.SP.2 - Trend lines
8.SP.3 - Interpreting linear models
8.SP.4 - Two-way tables and Relative-frequency tables
Use the interactive notebook pages as inspiration for how to organize your class's INB. Notes are included with each INB page to give tips and tricks for using th
Subjects:
Grades:
8th
Types:

Bundle G8 Bivariate Data & Scatter Plots-‘Relationship Status’ Performance Task
Bundle of 10 editions of Relationship Status Performance Task for 8th grade
In the Relationship Status Performance Task, students use real bivariate data from the thrill features of a roller coaster to practice constructing and interpreting scatter plots and to extend into drawing and interpreting a line of best fit in an engaging, real world context. Students take on the role of an engineer and use the data to discover the relationships between design features such as speed, ride duration, hei
Subjects:
Grades:
8th
Types:
Scatter Plot Intro Activity Worksheet
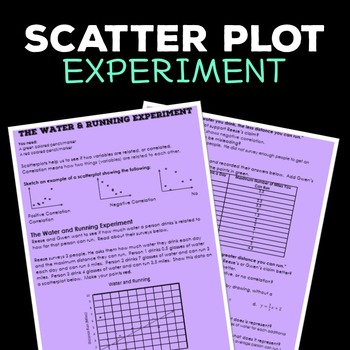
Students create a scatterplot based on data from an experiment and answer questions related to their graph. This activity can be completed as a whole class with guidance to introduce scatter plots and the vocabulary. Or, it may be used as independent practice if students are familiar with scatter plots. The student activity is 2 pages in PDF format. An answer key is included, along with extension questions. This activity can lead to great discussions about misleading graphs and the differen
Subjects:
Grades:
8th - 9th
Also included in: 8th Grade Math Activities & Lessons Bundle for the Whole Year
Scatter Plots Guided Notes - Scatter Plots and Line of Best Fit Notes
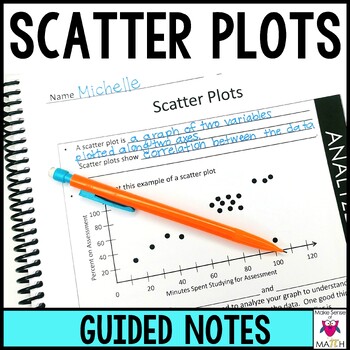
Save some time with these scatter plots guided notes that dive into correlations, linear associations, outliers, clusters, lines of best fit, and construction of scatter plots. These are perfect for 8th grade math or Algebra class. Your students will have a great undrstanding of scatter plots after going through these notes. IF YOU LIKE THESE NOTES THEN CHECK OUT ALL 8TH GRADE NOTES HERE!These in-depth guided notes contain:1 title page14 pages of guided notesCONTAINS 2 FORMATS: ONE WITH A BLACK
Subjects:
Grades:
8th - 9th
Also included in: 8th Grade Math Curriculum and Activities Bundle CCSS
Showing 1-24 of 221 results


