8 results
Common Core 7.RP.A.2b laboratories

Concept Comparison: Graphs in Science (Categorical vs Numerical)
How do scientists use graphs? This concept comparison helps students contrast bar graphs, pie charts and line graphs created from categorical and numerical data. The recall device uses DRY MIX and TRAILS as acronyms to help Ss remember how variables are plotted on a graph, and standard format for a graph. The frame comparison helps students contrast rate of change, slope shape and written relationships of functions (y vs. x; y vs. x^2; y vs. 1/x, and so on). THREE (3) activities are included:ha
Subjects:
Grades:
6th - 12th
NGSS:
HS-ETS1-3
, MS-ETS1-3
Also included in: StayGiant Physics Bundle: Measurement
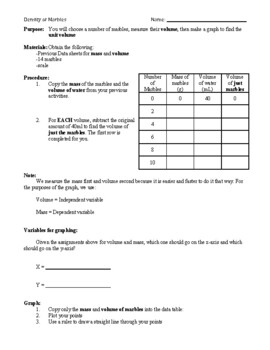
Graphing - Density Activity - Followup to Mass & Volume Activities
This is the third activity that takes data from the Mass Activity and Volume Activity to put them together to get the density of marbles. Students don't take any new data, but use their previous measurements of volume and mass to:1) create a Mass vs Volume graph, 2) draw a best fit line through their data,3) calculate the slope of the line, 4) write the equation of the line, and 5) use it to calculate the expected mass of 14 marbles to be compared to the actual mass of 14 marbles.For this activi
Subjects:
Grades:
7th - 9th
Types:
Also included in: Graphing - Linear relationship activities
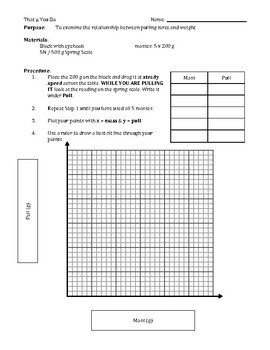
Graphing Activity - That Mu You Do - With Key
I do this activity with my freshman pre-algebra class to have them get experience with graphing "real data" points, then finding the slope of the "best fit line" and making meaning of what they did. A regular question in math class is "when am I ever going to use this?" This activity gives them something tactile to do with their hands that then makes the data points and the graph itself have real meaning for them and not just be numbers / dots on the page. I follow this activity up with "Graphin
Grades:
6th - 9th
Types:
Also included in: Physics Bundle
X vs Y: A Variable Recording and Graphing Lab
A 3 day to week long laboratory exploration into independent and dependent variables, and how equations like y=mx+b can describe the relationships between them.After breaking down the lab's instructions, students will get to choose their own x and y variables and then come up with a procedure for gathering data. Depending on how outgoing/creative they are, collecting the data for this lab can be a blast! Once they have 20 (x,y) samples, they will graph them and draw a line that fits the data. Th
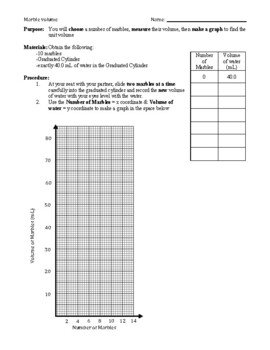
Graphing - Volume of Marbles - Proportionality constant, Slope-Intercept form
This is a hands-on activity that I do with both my General Science and Pre-Algebra classes. It ties experience of handling physical objects to concrete measurements of volume to abstract graph with finding and interpreting the slope.You will need to gather:1) Marbles of fairly consistent size (I got glass beads like these from the dollar store)2) 100mL Graduated Cylinders3) 40mL water for each GCThere are several skills practiced in this activity:1) Making precise measurements2) Data recording3)
Subjects:
Grades:
6th - 9th
Types:
CCSS:
Also included in: Graphing - Linear relationship activities
Graphing - Mass of Marbles & Pennies: Notes, Proportionality Constant, Slope KEY
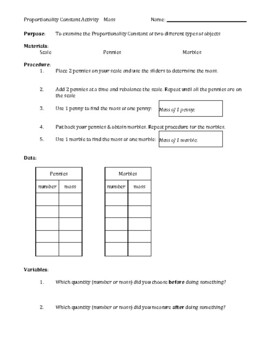
This is a set of notes + activity focused on teaching students to connect a data table to a graph to slope of a line through the idea of 'Constant of Proportionality'. Students are to find the total mass of sets of pennies and marbles and then graph Mass vs Number. From a line on the graph, they will find the slope of the line and connect it to the mass of a single penny (and marble) in the analysis questions. This is the first in a series of 4 activities that focus on linear relationships betwe
Subjects:
Grades:
6th - 9th
Types:
Also included in: Graphing - Linear relationship activities
Build A Scale Model of the Solar System
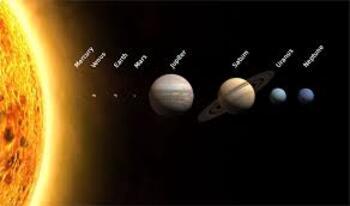
Objective: create a scale model of the solar system (planets only) showing -Part 1: The relative sizes (diameters) of the planets -Part 2: The relative distances of the planets from the sunMaterials 1 piece of paper [100cm x 50cm] scrap paper to cut upscissors metric ruler online resourcescompass mechanical pencil
Subjects:
Grades:
6th - 9th
Types:
NGSS:
MS-ETS1-2
, MS-ETS1-4
, MS-ESS1-3
Perfect Purple Paint Group Task
In this engaging color-mixing activity, students collaborate in heterogeneous groups to recreate the perfect purple paint discovered for a special room project. Originating from an 8 oz (1 cup) container, the challenge is to scale up the paint for larger 16 oz (2 cups) and 32 oz (4 cups) containers. Using red and blue food coloring, students explore ratios to achieve the identical shade, documenting their findings on a graph. The hands-on experiment encourages teamwork, critical thinking, and pr
Subjects:
Grades:
5th - 8th
Types:
Showing 1-8 of 8 results

