8 results
Common Core 8.F.A.2 laboratories

Concept Comparison: Graphs in Science (Categorical vs Numerical)
How do scientists use graphs? This concept comparison helps students contrast bar graphs, pie charts and line graphs created from categorical and numerical data. The recall device uses DRY MIX and TRAILS as acronyms to help Ss remember how variables are plotted on a graph, and standard format for a graph. The frame comparison helps students contrast rate of change, slope shape and written relationships of functions (y vs. x; y vs. x^2; y vs. 1/x, and so on). THREE (3) activities are included:ha
Subjects:
Grades:
6th - 12th
NGSS:
HS-ETS1-3
, MS-ETS1-3
Also included in: StayGiant Physics Bundle: Measurement
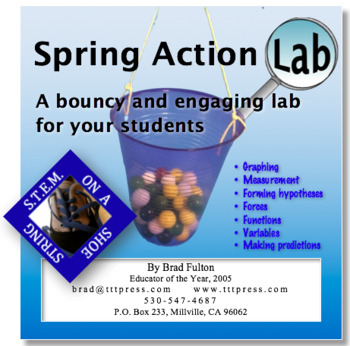
Spring Action Lab: A Bouncy and Engaging STEM Lab
Students will enjoy putting their learning to work in this engaging lab. Using springs or rubber bands, students measure and record data as they try to get a bucket to touch the floor by adding weights. Then they use their data and its graph to make predictions and write equations that will help them predict the outcomes. This simple and inexpensive lab will help your students learn graphing, t-tables, measurement, linear functions, and the physics of tension forces. This can be used as a stand-
Subjects:
Grades:
5th - 9th
Types:
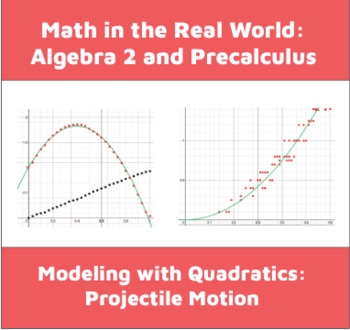
Quadratic Projectile Motion Lab with Data Set
In this activity, students analyze two different data sets that describe how projectiles fly through the air. The first describes the flight path of a thrown ball and the second describes the distance traveled by a ball dropped off a building over time. Using desmos.com, students fit linear and quadratic models to discover which quantities are related linearly (time and horizontal distance traveled) and which are related quadratically (time and vertical distance traveled.) They are asked to inte
Subjects:
Grades:
8th - 12th
CCSS:
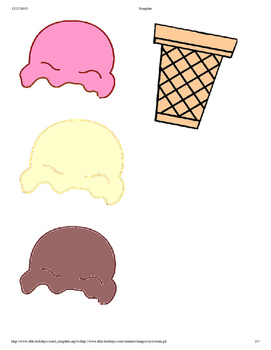
My Own Ice Cream Cone: Slope Activities 1
Introductory lesson to using data to create a linear growth graph and model by building "fake" ice cream cones. Templates are included for the cones and scoops. Instructions for the teacher are also included. Contact me at hrudolph@orangecsd.org for details or clarification. Students will be introduced to appropriate vocabulary such as initial amount, slope, intercept, growth, increasing, model, trend, linear function or linear equation. Lamination is helpful for re-using the materials! A
Subjects:
Grades:
5th - 8th
Types:
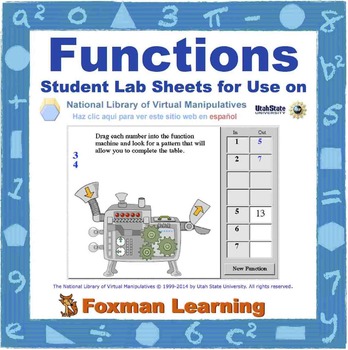
Functions -- Virtual Manipulatives Lab for Middle School Math Common Core
This lab guides students through four of the algebra virtual manipulatives (applets) from the nlvm website: Point Plotter, Line Plotter, Grapher, and Function Machine. These virtual manipulatives are a great way for students to explore the foundations of functions and graphs in a fun and conceptual format. My students really enjoy working through these labs and I enjoy the math understanding and discussions that follow. Five other nlvm labs for Middle School Math are available in My TpT Store -
X vs Y: A Variable Recording and Graphing Lab
A 3 day to week long laboratory exploration into independent and dependent variables, and how equations like y=mx+b can describe the relationships between them.After breaking down the lab's instructions, students will get to choose their own x and y variables and then come up with a procedure for gathering data. Depending on how outgoing/creative they are, collecting the data for this lab can be a blast! Once they have 20 (x,y) samples, they will graph them and draw a line that fits the data. Th
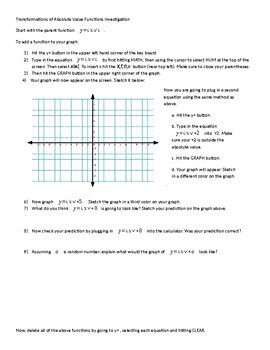
Transformations of Absolute Value Functions for TI-84
This investigation walks students through Absolute Value Transformations using a TI-84 calculator.
Subjects:
Grades:
8th - 10th
Types:
CCSS:
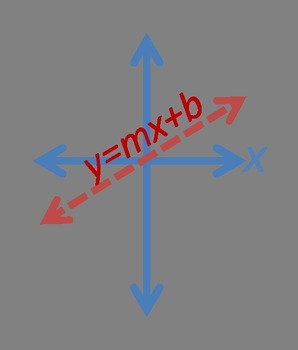
Algebra Functions by Hand
Teach your students how to graph functions without a calculator. Using a basic y=mx+b format, give some x values in a table, have the students calculate the y value, convert to order pairs (O.P.). Finally, they graph their points and voila! A function is born! Also include is basic translation, reflection, and identification of O.P., and values of b, m, and y from a graph.
TAGS: functions, graphing, table, slope-line intercept, ordered pair, reflection, translation, algebraically, graphically, n
Subjects:
Grades:
8th - 10th
Types:
Showing 1-8 of 8 results

