16 results
Statistics classroom decors $10 and up
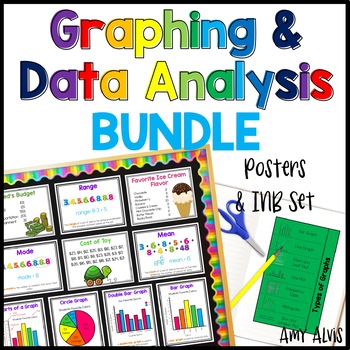
Graphing and Data Analysis Bundle Posters Interactive Notebook INB Anchor Chart
This bundle includes my Graphing Poster and Interactive Notebook (INB) set, my Data Analysis Poster and Interactive Notebook (INB) set and my Data Posters and Cards. Make sure to check the links below to see what comes with each set.This bundle includes:1. My best selling Graphing - Poster and INB Set.This poster and interactive notebook (INB) set includes FOURTEEN posters covering bar graphs, double bar graph, pictographs, picture graph, line graphs, double line graph, line plot, circle graphs
Subjects:
Grades:
2nd - 6th
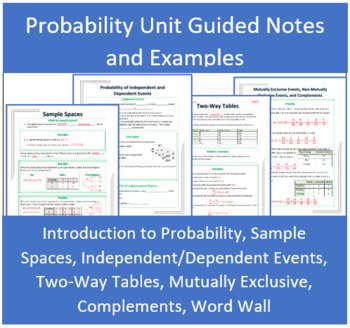
Probability Unit Guided Notes and Practice
The Probability Guided Notes and Practice bundle was made for a high school geometry level course, but could be used for a Probability/Statistics course or an honors level middle school course as well. Included in this bundle is four sets of guided notes and a word wall covering the following topics: Introduction to Probability, Sample Spaces, Independent and Dependent Events, Two-Way Tables, Mutually/Non-Mutually Exclusive Events, and Complements. The scaffolded notes provide an extra opportuni
Subjects:
Grades:
6th - 12th
CCSS:
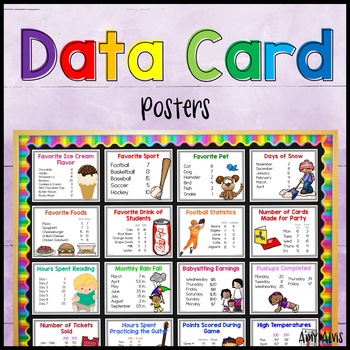
Data Cards to use with Graphing and Data Analysis
These data file cards are the perfect addition to your data analysis unit. The cards can be used to make graphs or used to calculate mean, median, mode and range.You will receive the following (each type will be a separate PDF):84 color full size data set cards84 b&w full size data set cards21 pgs of mini color data set task cards (4 per page- all different)84 pgs of mini b&w data set task cards (4 per page - all the same)The following is how I have listed the cards and their intended us
Subjects:
Grades:
Not Grade Specific
Types:
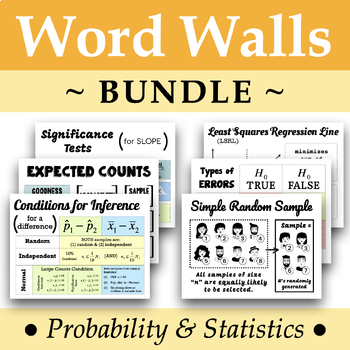
Statistic Word Wall BUNDLE
A bundle of the #1 to #12 Statistics Word Walls.
Subjects:
Grades:
9th - 12th
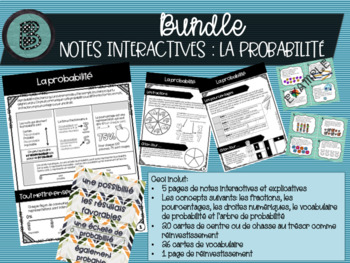
BUNDLE probabilité: notes interactives, cartes et vocabulaire
Voici 5 pages de notes interactives pour bien expliquer la probabilité en employant plusieurs concepts: les fractions, droite numérique, pourcentage, vocabulaire à l'étude et un arbre de probabilité. Ces notes permettent aux élèves d'étudier les concepts, ainsi que comprendre visuellement comment ils sont entre reliés. À la fin, il y a une feuille de réinvestissement. Ceci inclut mes cartes de probabilité qui pourraient être utilisé comme centre, ou activité de classe. Il y a 20 questions en tou
Subjects:
Grades:
4th - 7th
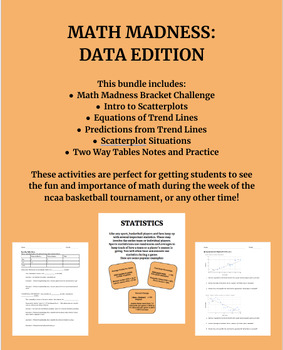
Math Madness: Bivariate Data in Basketball
This bundle includes all of my basketball themed items that involve bivariate data (scatterplots and two way tables) at the 8th grade level along with the basketball mini posters and math madness bracket challenge. This bundle is designed to be used together throughout the week(s) of the college basketball tournament, or any other time you wish to bring fun basketball activities into the math classroom!
Subjects:
Grades:
8th
Types:
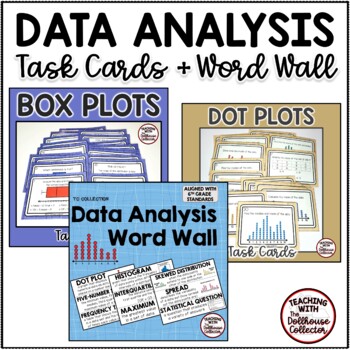
Data Analysis Task Cards and Word Wall for 6th Grade Math Statistics Unit
This data analysis task cards and vocabulary word wall bundle features box plots, dot plots, and data distributions to identify the mean, median, range, interquartile range (IQR), five-number summary, and shape of data distribution. The bundle includes:33 word wall cards40 task cardsResponse sheetsAnswer keysAdd these engaging resources to your 6th grade Statistics and Probability math lessons and use them for: math centerssmall group guided mathtest reviewmorning workfor early finishers! Aligne
Subjects:
Grades:
5th - 7th
Types:
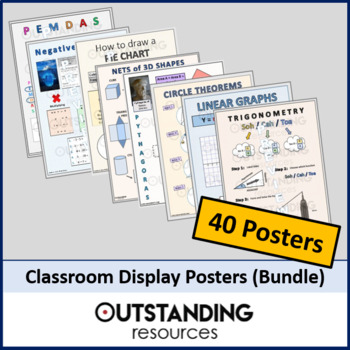
Math Posters Bundle
This is an excellent bundle of 41 Math Posters to reinforce learning and to create the right environment within the Mathematics classroom. The 41 Posters include: linear graphs, sequences, solving equations, pie charts, probability, averages, sets, stem & leaf, Pythagoras, basic trig, sohcahtoa, bearings, angle rules, transformations, circle theorems, area, volume, multiplication, pemdas, multiples, factors, prime factor trees, negative numbers, ratio, binomial Distribution, quadratic graphs
Subjects:
Grades:
6th - 9th
Types:
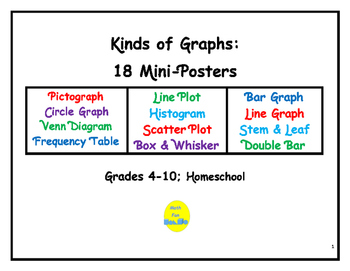
Kinds of Graphs: 18 Mini-Posters
These 18 mini-posters illustrate the various types of graphs studied in all grades: pictograph, line and bar graphs, box and whisker, stem and leaf, circle, histogram, Venn Diagram, matrix, scatter plot, and frequency tables. Each mini-poster contains a list of characteristics, an example, and vocabulary terms in bold face type.
By Math Fan
Subjects:
Grades:
5th - 9th
ULTIMATE Focus on Probability
12 Probability Games and ActivitiesLooking for cool probability activities and probability games for kids? Probability is an area of mathematics that often doesn't get its fair share of attention in elementary & middle school classrooms. The following activities introduce a variety of probability concepts by examining the mathematics in some common games of chance.Basics of ProbabilityGreen Monsters, Red MonstersProbabilities with Playing CardsProbability Dice GameThe Sock in the Sock Dr
Subjects:
Grades:
3rd - 8th
Types:
Also included in: Buy My Store - Math Mega Bundle
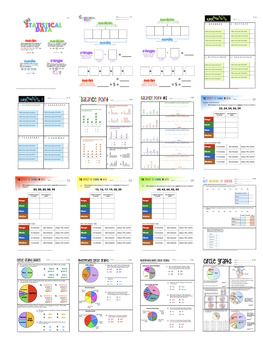
Mr. A's Data & Statistics Bundle (80 pages)
Here's a little something I created for my students for their Data & Statistics Unit in 6th grade. The following are included.28 different worksheets & answer keys25 instructional display sheets80 pages in allYou can buy all of these separately if desired. Save yourself a few dollars by getting the bundle. The worksheets asks students to compile and analyze data using frequency charts, circle graphs, histograms, pictographs, bar graphs, and stem-leaf plots. Some of the activities all
Subjects:
Grades:
6th
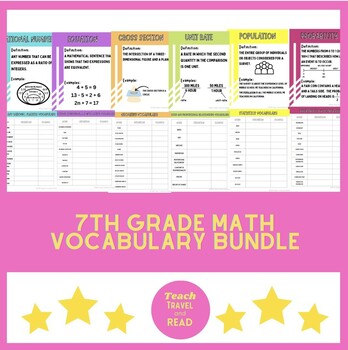
7th Grade Math Vocabulary Bundle
These 8.5 in. x 11 in. vocabulary posters are great decor for a math classroom teaching 7th grade math that aligns with CCSS. They can be printed (in color or black and white) and laminated to use for years to come. There is also a vocabulary student worksheet with three columns for students to fill out the vocabulary word, definition, and an example.The bundle is broken down into 6 units (each unit can be sold separately):Integers and Rational NumbersRatios and Proportional RelationshipsExpress
Subjects:
Grades:
7th
~ * STATISTICS & PROBABILITY BUNDLE * ~ tropical theme
This is a set of Seventh Grade Statistics & Probability Resources, done in a TROPICAL color scheme. This set includes anchor chart posters, guided notes, objectives, and word wall posters to give your students resources everywhere they turn! This resource was put together using Canva. You will get the individual anchor charts, word wall posters, objective posters, and guided notes as a picture file (PNG) or in PDF format. Each item is intended to be printed as followed: Guided NotesPrint t
Subjects:
Grades:
6th - 8th
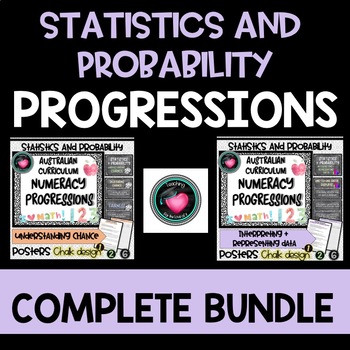
STATISTICS & PROBABILITY NUMERACY PROGRESSIONS POSTERS + CHECKLISTS BUNDLE
NUMERACY PROGRESSIONS POSTERS + CHECKLISTSBUNDLE Australian Curriculum STATISTICS AND PROBABILITYUnderstanding chanceInterpreting and representing dataThese posters have been made to display the Numeracy ProgressionsFORTHE STATISTICS AND PROBABILITY STRAND OF THE NUMERACY PROGRESSIONSUse as a bump it up wall.Included:Posters of All ProgressionsNumbers in large circles for display of the levels.Individual checklist FOR EACHA one page class checklist FOR EACHSuccessful teaching and learning to add
Subjects:
Grades:
Not Grade Specific
Types:
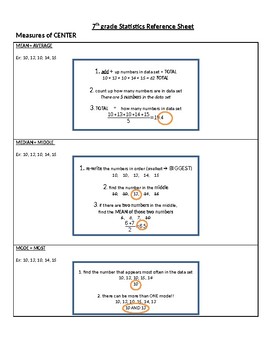
7th grade Statistics - Unit Reference
2018-2019 7th grade statistics unit reference guide. Supporting mastery of grade level objectives. Students will be able to define what makes a strong statistical sample, students will compare related data sets to draw conclusions about past trends and make predictions for the future, students will represent data sets visually through box plots, histograms, and other graphical tools, and utilize these in combination with numerical statistical measures in order to support their conclusions and
Subjects:
Grades:
6th - 8th
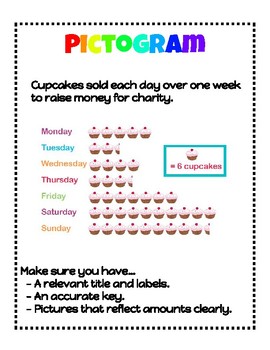
Statistics Graph Types Learning Display
A colourful learning display of various graph types and explanations for your students to refer to
Subjects:
Grades:
5th - 8th
Types:
Showing 1-16 of 16 results


