270 results
6th grade statistics classroom decors
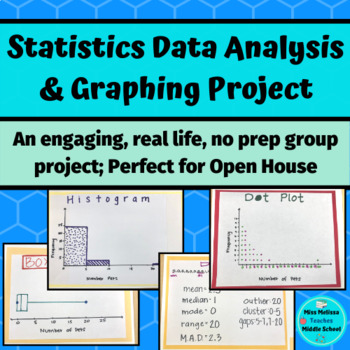
Statistics Project: Data Analysis & Graphing- real life, no prep
This statistics project is intended as a closure for your sixth grade statistics unit and aligns with ALL of the sixth grade statistics and probability common core state standards. In groups, students work together to choose a statistical question to ask the class. Once the class is surveyed, the group works together to create a frequency table, a dot plot, a histogram, and a box and whiskers plot. After creating their graphs, the groups analyze their data by looking at the mean, median, mode ra
Subjects:
Grades:
6th - 7th
Types:
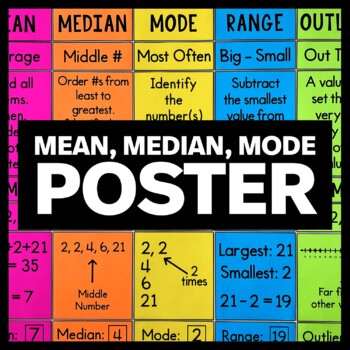
Mean, Median, Mode Poster - Measures of Central Tendency - Math Classroom Décor
Do you need a little help teaching measures of central tendency to your math class? Are you looking for a mean, median, and mode bulletin board display? This poster will look GREAT on your word wall and will help your upper elementary or middle school math class remember this important concept. Two different versions of the poster are included along with several alternate panels for mean, median, mode, and range. Extra panels for "outlier" are not included.The first version of the poster has
Subjects:
Grades:
5th - 8th
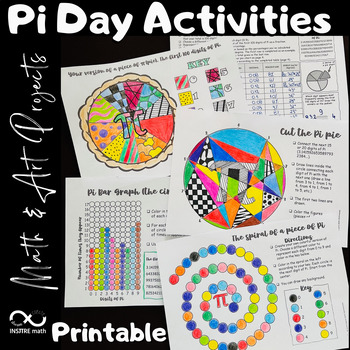
4 Pi Day Math Activities | Math & Art Projects | Coloring Circles | Pie Chart
4 Math & Art Projects to celebrate Pi Day that include circles and Pi exploration! Your students will love these Pi Day activities! Let your students express themselves using these hands-on Math & Art resources during the exploration of Pi.Content:- Your version of a piece of π (pie). The first 100 digits of Pi. Frequency Pie Chart.- Pi Bar Graph - the circular version.- The spiral of a piece of Pi.- Cut the Pi pie.This resource includes:- The editable PowerPoint™ version.- The printable
Subjects:
Grades:
4th - 8th
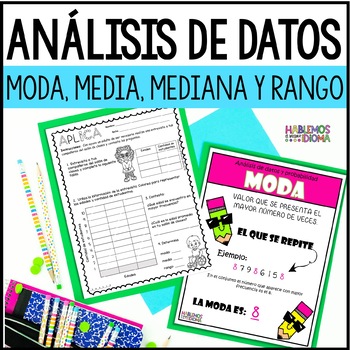
Análisis de datos moda, media, mediana y rango | Interpretación gráficas
¿Necesitas actividades para trabajar con tus estudiantes de grados primarios el análisis de datos (moda, media, mediana y rango) e interpretación de gráficas de una forma sencilla y divertida? Este recurso incluye carteles, hojas de trabajo, plegables para libreta interactiva y más.El siguiente recurso se llevó a cabo con la intención de ofrecer acceso curricular a la destreza de una forma sencilla y atractiva para el estudiante. El recurso se desarrolló para un aula inclusiva está dirigido a
Subjects:
Grades:
4th - 8th
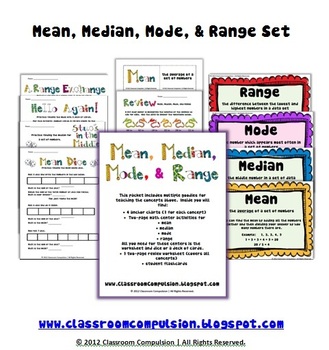
Mean Median Mode Range Pack (Math Centers, Flashcards, Anchor Charts)
This pack has everything you need to supplement your Mean, Median, Mode, and Range instruction! It includes 4 colorful anchor charts (1 for each concept)for you to display around the room, 4 two-page math centers that only require dice or a deck of cards (1 for each concept), a fun set of flashcards for your students, and a two-page review worksheet that covers all the concepts. The preview photos do not show all the pages.
Subjects:
Grades:
3rd - 6th
CCSS:
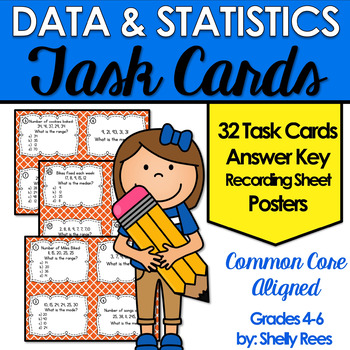
Mean, Median, Mode, Range Task Card and Poster Set - Data and Statistics
Mean, Median, Mode, Range, Data and Statistics is easier for students to master with this easy-to-use set of task cards and posters! Students will love the variety of practice with this task card set, and teachers will enjoy the little prep with big results!
Click here and SAVE by buying the Complete Bundle of Math Task Cards for Grades 4-6.
This helpful Data and Statistics Task Card Set includes:
• 32 Task Cards (28 on-level and 4 challenge)
• 5 Example and Teaching Posters
• 2 Standard Pos
Subjects:
Grades:
4th - 7th
Types:
CCSS:
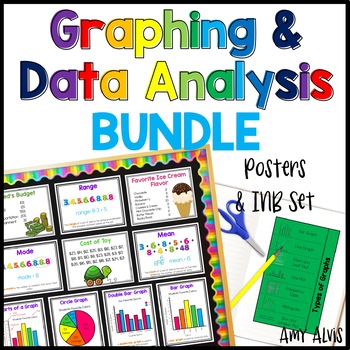
Graphing and Data Analysis Bundle Posters Interactive Notebook INB Anchor Chart
This bundle includes my Graphing Poster and Interactive Notebook (INB) set, my Data Analysis Poster and Interactive Notebook (INB) set and my Data Posters and Cards. Make sure to check the links below to see what comes with each set.This bundle includes:1. My best selling Graphing - Poster and INB Set.This poster and interactive notebook (INB) set includes FOURTEEN posters covering bar graphs, double bar graph, pictographs, picture graph, line graphs, double line graph, line plot, circle graphs
Subjects:
Grades:
2nd - 6th
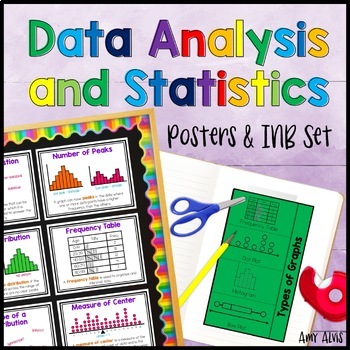
Data Analysis and Statistics Posters and Interactive Notebook INB Set
This poster (anchor chart) and interactive notebook (INB) set covers statistical questions, numerical data, categorical data, frequency table, dot plot, histogram, box and whisker plot, box plot, parts of a box and whisker plot, parts or a box plot, measure of center, spread, shape of distribution, symmetry, number of peaks, skewness, uniform distribution, outlier and gaps. The INB pages cover Types of Graphs, Statistical Questions and Patterns in Data.It includes 3 different interactive foldabl
Subjects:
Grades:
6th - 8th
Also included in: 6th Grade Posters and Interactive Notebook INB BUNDLE Anchor Chart
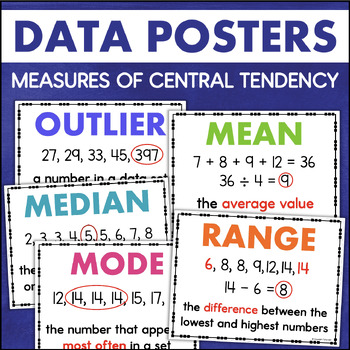
Mean Median Mode and Range POSTERS Data Measures of Central Tendency
These data collection posters will support your students as they learn about analyzing data. Includes 6 clear, simple anchor charts that include a definition and example. Bold fonts make them easy to see from across the room.Includes the following measures of central tendency:meanmedianmoderangefrequencyoutlierEach of these data posters measures 8x10 but can be enlarged if needed.
Subjects:
Grades:
5th - 7th
Types:
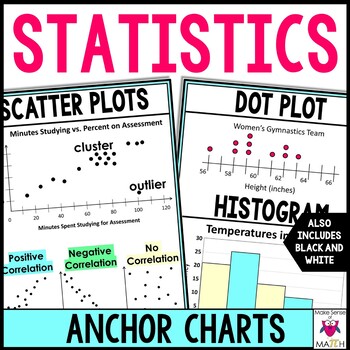
Statistics Anchor Charts Posters | Middle School Math Statistics
These statistics anchor charts or personal reference sheets include visuals for dot plots, histograms, box plots, and scatter plots. They also include measures of center: mean, median, and mode, as well as measures of variation: interquartile range and mean absolute deviation. Colored and black and white copies are included. Colored and black and white copies are included. Check out the preview to see all the anchor charts. Includes: Dot Plot and HistogramBox PlotMeasures of Center: Mean, Medi
Subjects:
Grades:
6th - 8th
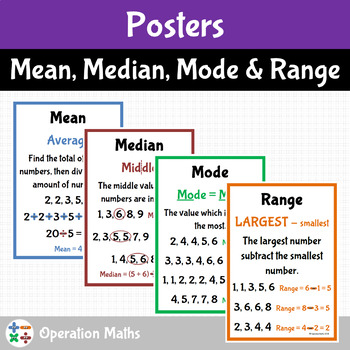
Mean, Median, Mode and Range Posters
These bright and colourful posters can be used for display or laminated and used during lessons.The pack includes the following with an explanation and at least one example of how to work them out.· Mean poster· Median poster· Mode poster· Range poster· All four posters on one pageThe A to Z Booklet for Mean, Median, Mode and Range can be found here.
Subjects:
Grades:
5th - 8th
Types:
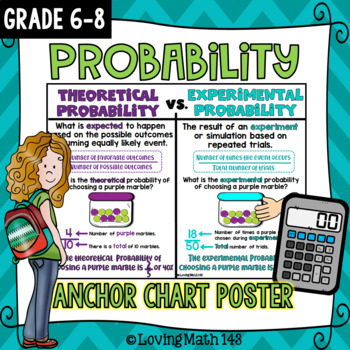
Theoretical vs. Experimental Probability Anchor Chart Poster
This probability and statistics anchor chart is compares experimental and theoretical probability for middle school math students. Students will be able to see the difference between different probabilities and use this as a scaffold and reference when working with probability. It is a great tool to display in your classroom and/or distribute to your students to place in their interactive notebooks or binder. This anchor chart is aligned with the 7th grade Probability and Statistics Common Core
Subjects:
Grades:
6th - 8th
Also included in: 6th Grade Math Anchor Posters for the whole Year! {BUNDLE!}
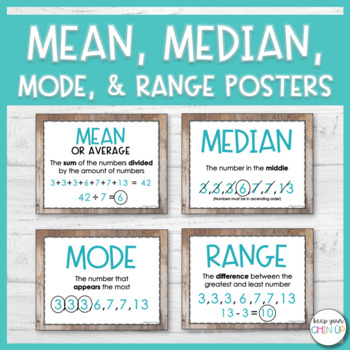
Mean, Median, Mode, and Range Posters
Looking for a visual to help your students with determining the mean, median, mode, and range of a data set? These simple posters are designed to help your students remember key words and formulas for each of the terms.
WHAT'S INCLUDED?
► 2 Options for printing (color or black & white)
► Posters for the terms: mean, median, mode, range, and data set
► Vocabulary worksheet
► Practice worksheet
Subjects:
Grades:
4th - 6th
Types:
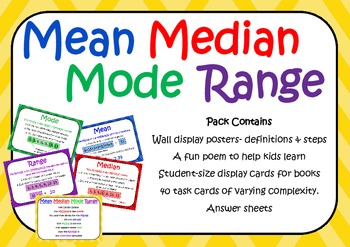
40 Mean Median Mode & Range Task Cards (> 80 questions), Posters & More
This pack is designed to give students a thorough understanding of mean, median, mode and range. It includes a fun poem (to the tune of Hey Diddle Diddle) to give students a way of always remembering how to calculate the mean, median, mode or range of any data set, as well as 40 task cards of varying complexity, wall reference posters and reference cards for student’s books.The yellow task cards (1-20) are the easier ones and the orange (21-40), the more complex. The cards can be used in centers
Subjects:
Grades:
4th - 8th
Types:
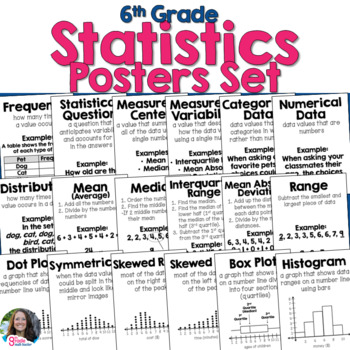
6th Grade Statistics Posters Set for Anchor Charts or Word Wall
There is so much vocabulary for 6th Grade Statistics! Students need to be able to reference the terms and see examples of all the new vocabulary they must learn. This set of 20 printable posters provides visuals and definitions of all the terms for students during your Grade 6 statistics and data unit!The posters are neat, clear, and organized. They are black and white and can be printed on card stock from your own printer. Hang them on your word wall for students to access the critical vocabula
Subjects:
Grades:
6th
Types:
Also included in: 6th and 7th Grade Statistics Posters for Word Wall BUNDLE
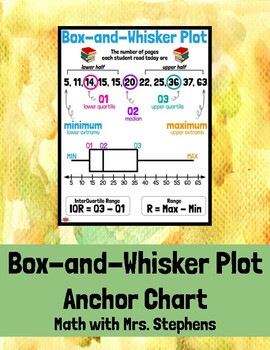
Box-and-Whisker Plot Anchor Chart
This anchor chart displays a data set with its corresponding box-and-whisker plot. It includes vocabulary of the "5 Number Summary", such as minimum, lower quartile, median, upper quartile, and maximum. The range and IQR are also represented. This can be printed one per page for individual student binders/notebooks or enlarged to be printed as a poster or anchor chart.
Subjects:
Grades:
6th - 8th
CCSS:
Also included in: 6th Grade Math (& More) Anchor Charts *BUNDLE*
Probability Anchor Charts Posters | Middle School Math Probability
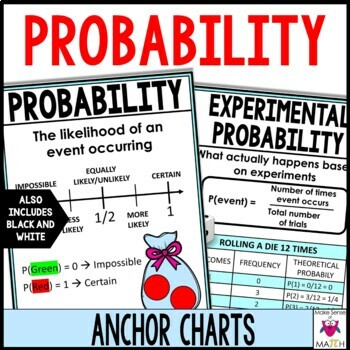
These probability anchor charts or personal reference sheets include visuals for probability, theoretical and experimental probability, tree diagrams, and a quick run down of probability vocabulary. Colored and black and white copies are included. Includes: ProbabilityTheoretical ProbabilityExperimental ProbabilityTree DiagramsProbability VocabularyHow to create your own poster instructionsOther Products you may be Interested in▸ Statistics Anchor Charts▸ Probability Activity - Law of Large Nu
Subjects:
Grades:
6th - 8th
Types of Graphs Maths Posters for Year 3, 4, 5 & 6 Students
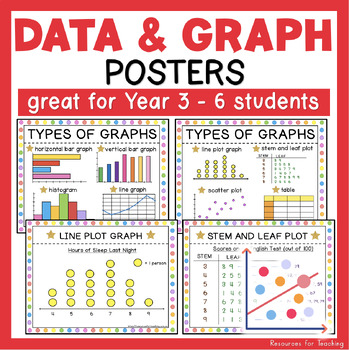
These vivid types of graphs maths posters are perfect for Year 3, 4, 5 & 6 students learning to collect, interpret and organise data in math lessons. All these posters are fantastic for using during a class discussion to differentiate between different graphs by looking at the physical characteristics and then interpreting the information. The Posters Include:1) Types of Graphs: horizontal bar graph, vertical bar graph, histogram, line graph, line plot graph, stem and leaf plot, scatter plot
Subjects:
Grades:
3rd - 6th
Types:
Mean Median Mode Range Poster Notes Anchor Chart
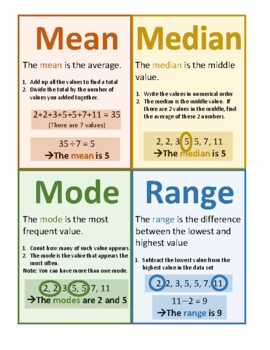
The PDF poster describes mean, median, mode, and range in an easy-to-understand and visual way. Enjoy!Check out my other posters here:STEM: Women in STEM Insp. Quotes, Women in STEM, Careers, Heroes Timeline, Inspirational Quotes from STEM HeroesABCs of Math: STEM Innovations, Amazing STEM facts, Careers, Shapes, in Nature Modern Style, in Nature Vintage Style, in Everyday LifeMath Vocabulary Alphabet: Elementary, Middle School, High SchoolMath in Art: Set A, Set B, Big BundleMath Modelling: Se
Subjects:
Grades:
5th - 9th
Types:
Finding Mean, Median, Mode, and Range
Simple worksheets (5 problems each) to introduce and practice finding the mean, median, mode, and range of a data set. Have students complete with or without calculator, depending on their instructional level. Product includes:-Reference posters for mean, median, mode, and range. Each poster includes the measures' definitions and directions for how to find them with an example.-5 worksheets about finding the mean.-5 worksheets about finding the median.-5 worksheets about finding the mode.-5 work
Subjects:
Grades:
1st - 12th
Types:
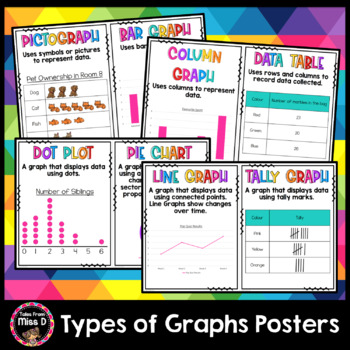
Types of Graphs Posters
Use these Types of Graphs posters for a class display to remind students about the different types of graphs. There are 7 different posters;PictographBar Graph/Column GraphData TableDot PlotPie ChartLine GraphTally GraphAustralian and American spelling is catered for.Have a question? Use the Product Q & A or email me at talesfrommissd@gmail.comFind Related Products HereMath Operations Posters, Times Table Posters, Math Vocabulary Posters, Missing Addends Posters, Preposition Posters, Ordinal
Subjects:
Grades:
3rd - 6th
Types:
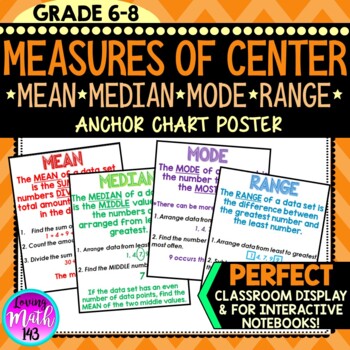
Mean, Median, Mode, Range Anchor Chart Poster
This middle school math anchor chart poster is a great tool to display in your classroom or distribute to your students to place in their interactive notebooks and/or binder. This anchor chart is great break down of mean, median, mode, and range. This anchor is aligned with the 6th and 7th grade Common Core standards students. GET THIS ANCHOR CHART BY PURCHASING MY MATH ANCHOR CHART BUNDLE! CHECK IT OUT HERE!***************************************************************************************
Subjects:
Grades:
6th - 10th
CCSS:
Also included in: 6th Grade Math Anchor Posters for the whole Year! {BUNDLE!}
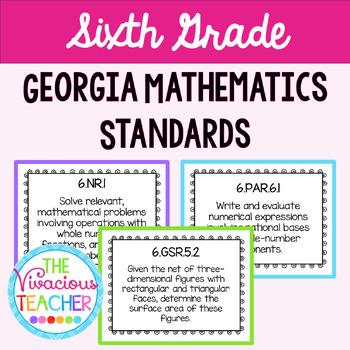
Georgia Mathematics Standards Posters for Sixth Grade
This pdf file includes Georgia Mathematics Standards posters for Sixth Grade. They have been updated for the 2023-2024 school year. These posters were designed in black and white so you can save your color ink! I print these posters on colored card stock and laminate so they are ready to hang in my classroom year after year.Standards included:Mathematical Practices and ModelingNumerical ReasoningPatterning and Algebraic ReasoningGeometric and Spatial Reasoning♥♥♥♥♥♥♥♥♥♥♥♥♥♥♥♥♥♥♥♥♥♥♥♥♥♥♥♥♥♥♥♥♥♥♥♥
Subjects:
Grades:
6th
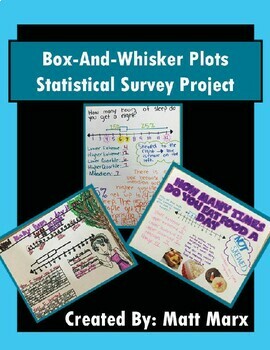
Box And Whisker Plots - Statistical Survey Project
Box-And-Whisker Plots - Statistical Survey ProjectThis Statistical Survey Project offers students the opportunity to demonstrate an understanding of Statistics content through the lens of a personalized statistical survey and the creation/study of a Box-And-Whisker Plot.Students insert themselves into their learning by selecting their own personalized survey question. Students have fun creating their posters, sharing them with the class, and having them displayed for all to see in the classroom.
Subjects:
Grades:
6th - 12th, Higher Education, Adult Education
Types:
CCSS:
Showing 1-24 of 270 results


