68 results
Higher education statistics posters
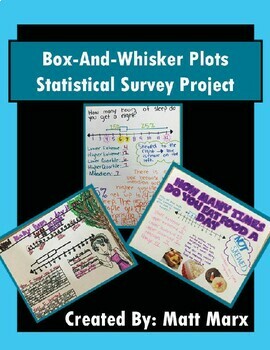
Box And Whisker Plots - Statistical Survey Project
Box-And-Whisker Plots - Statistical Survey ProjectThis Statistical Survey Project offers students the opportunity to demonstrate an understanding of Statistics content through the lens of a personalized statistical survey and the creation/study of a Box-And-Whisker Plot.Students insert themselves into their learning by selecting their own personalized survey question. Students have fun creating their posters, sharing them with the class, and having them displayed for all to see in the classroom.
Subjects:
Grades:
6th - 12th, Higher Education, Adult Education
Types:
CCSS:
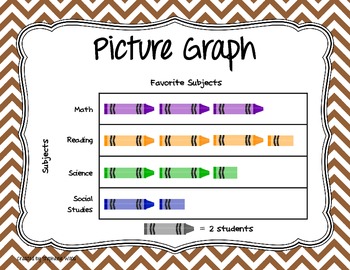
Types of Graphs Posters
Posters showing the various types of graphs for data display.
Includes:
Line Plot/Dot Plot
Line Graph
Bar Graph (Horizontal and Vertical)
Stem & Leaf Plot
Histogram
Box & Whisker Plot/Box Plot
Frequency Table
Circle Graph
Pictograph
Subjects:
Grades:
K - 12th, Higher Education, Adult Education
Types:
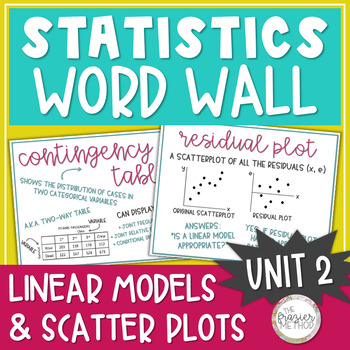
Statistics Word Wall Posters - Scatter Plot, Linear Model, Residual, Correlation
Use these Statistics Posters to add high school math classroom decor to your bulletin board, hallway, math word wall, or classroom door with these great 8.5" by 11" Statistics Word Wall pages filled with statistics vocabulary, formulas, and graphs! \Put them up one at a time as you teach through each term or display them all at once. All vocabulary, formulas, and graphs are from Unit 2: Exploring Two-Variable Data in AP Statistics, and the information on each slide aligns with AP College Board'
Subjects:
Grades:
10th - 12th, Higher Education
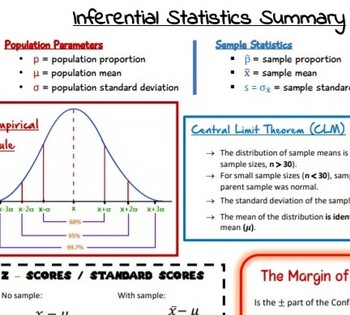
Inferential Statistics Summary
Included: complete PDFA summary of the notation and formulas for Higher Level Leaving Certificate Inferential Statistics:Empirical RuleCentral Limit TheoremZ / Standard ScoresMargin of ErrorConfidence IntervalHypothesis TestP Value
Subjects:
Grades:
11th - 12th, Higher Education
Types:
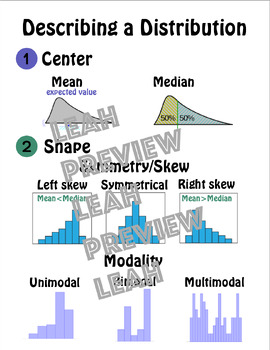
AP Statistics Word Wall Posters - Printer Friendly
Statistics can be overwhelming with all of the terminology and specifics. Make it easier for your students to understand with these colorful visuals, tailored to the AP Statistics curriculum. Included are 15 posters with the following concepts: describing a distribution (center; shape; variability - range, standard deviation, interquartile range; unusual features), population vs sample, parameter, statistic, standardized/z-score, normal distribution, empirical rule, standard normal table, least
Subjects:
Grades:
9th - 12th, Higher Education
Types:
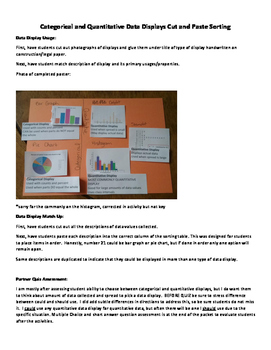
Catagorical and Quantitative Data Displays
Introduction statistics activity to help students determine which data displays should be chosen based on a set of given data. Activity includes a poster creation activity which requires students to match displays to titles and descriptions, a sorting task requiring students to decide based on descriptions of data which displays would best display them, a partner quiz intended to assess knowledge after completing first two activities.
8 pages includes two brief pages of keys. This item does in
Subjects:
Grades:
11th - 12th, Higher Education
Types:
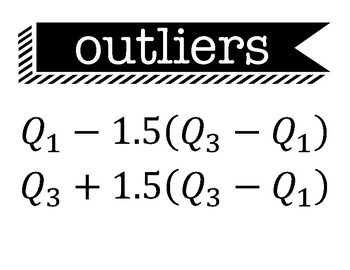
AP Statistics Formula Posters
These pages contain a great way to display the formulas students are required to know for the AP Statistics exam. These can be printed on 8.5"x11' paper and displayed in your classroom! This product contains 14 pages with the following formulas and definitions:OutliersResiduals, Standard score,Combining mean and variance,Converting mean and variance, Geometric Probability and mean,exponential and power model, definitions for confidence level, p value, and r squared
Subjects:
Grades:
9th - 12th, Higher Education, Adult Education
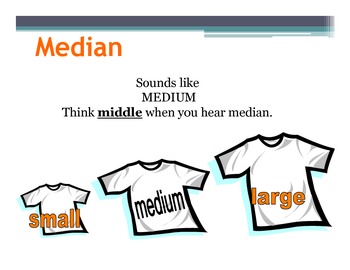
Math Posters:Mean, median, mode, range (30 Posters)
Mean, median, mode, range (30 Posters)
30 Beautiful and colorful posters.
I posted these posters in my classroom, and my students found the explanations very useful!!! (The last three slides are about Math songs (Mean, median, mode)
MY OTHER MATH POSTERS
Math Poster: SOHCAHTOA
Math Posters : Real Numbers
Math Posters : Tools For Algebra and Geometry (30 Posters)
Math Posters :Triangles (20 Posters)
Math Posters: 10 COMMON ERRORS IN ALGEBRA
Math Posters: Keywords of addition,subtraction
Subjects:
Grades:
4th - 12th, Higher Education, Adult Education, Staff
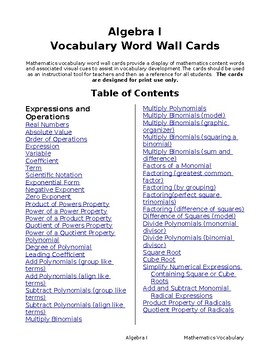
Algebra I Vocabulary Posters (110 Pages )
Looking for a quick and easy way to practice Math Vocabulary?These colorful and concise Posters and Flashcards are a great way to reinforce math concepts. Hang on a bulletin board and keep on a ring for reviewing.
Subjects:
Grades:
6th - 12th, Higher Education, Adult Education
Types:
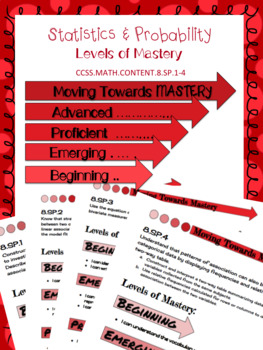
8.SP Scatter Plot & Two-Way Table Levels of Mastery
This product was created to use as an introduction to teaching the eighth grade statistics and probability standards. It allows students to evaluate themselves throughout the process of teaching the standards. It can be printed and provided to each student or printed as posters to be hung in the classroom for easy reference.
Levels of mastery are:
→ Beginning
→ Emerging
→ Proficient
→ Advanced
Levels of Mastery Posters:
★ 8.SP.1 Constructing & Interpreting Scatter Plots
★ 8.SP.2 Line of
Subjects:
Grades:
8th, Higher Education
Types:
CCSS:
Also included in: 8th Grade Math Common Core Growing Bundle
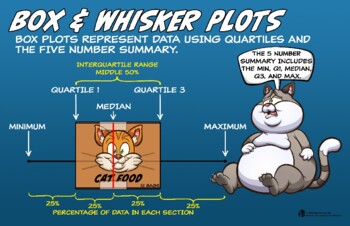
Box and Whisker Plot Poster
This 11 x 17 inch poster provides the definition and example of a Box and Whisker Plot.
Subjects:
Grades:
6th - 12th, Higher Education, Adult Education
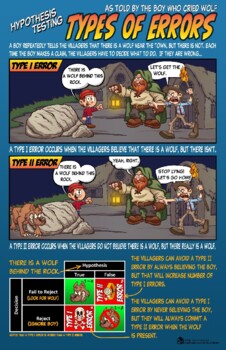
Hypothesis Testing Error Types (Type I and Type II) Poster
This 11 x 17 inch poster provides a definition and example of Type I and Type II Errors.
Subjects:
Grades:
9th - 12th, Higher Education, Adult Education
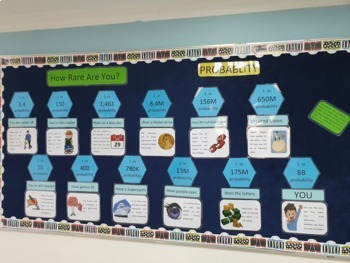
How rare are you? statistics and probability bulletin board
Statistics and probability / AP statistics bulletin board.document contain all papers.pages with photos should be printed with colors and others use colored papers of your choice.Cheeeers!
Subjects:
Grades:
12th, Higher Education, Adult Education, Staff

One-Way ANOVA Poster
This 11 x 17 inch poster provides the definition and example of the one-way ANOVA.
Subjects:
Grades:
9th - 12th, Higher Education, Adult Education
Types:
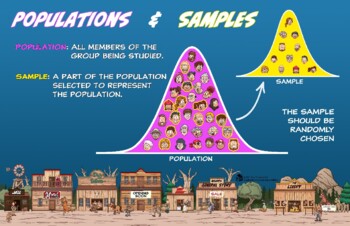
Populations and Samples Poster
This 11 x 17 inch poster provides the definition and example of the population and sample.
Subjects:
Grades:
9th - 12th, Higher Education, Adult Education
Types:
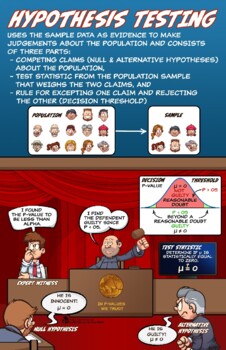
Hypothesis Testing Poster
This 11 x 17 inch poster provides an explanation of the process of Hypothesis Testing.
Subjects:
Grades:
9th - 12th, Higher Education, Adult Education
Types:
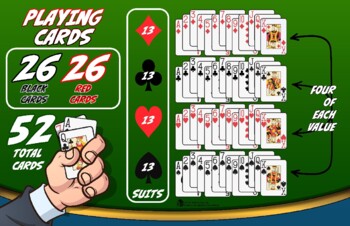
Playing Cards Probability Poster
This 11 x 17 inch poster provides a breakdown of the playing cards in a standard deck. This is a must-have for students who are solving probability problems involving playing cards.
Subjects:
Grades:
5th - 12th, Higher Education, Adult Education
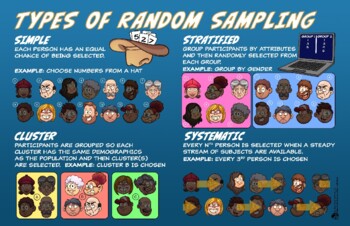
Random Sampling Techniques Poster
This 11x17 inch poster explains the four primary methods of random sampling.
Subjects:
Grades:
5th - 12th, Higher Education, Adult Education, Staff
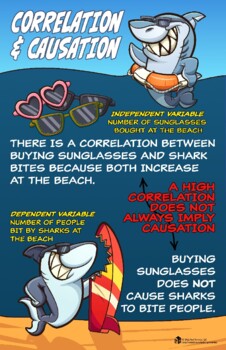
Correlation v. Causation
This 11x17 inch poster includes the differences between correlation and causation.
Subjects:
Grades:
5th - 12th, Higher Education, Adult Education

Statistics: The Great Gummy Bear Experiment (Experiments)
Students are put into groups and given a question they need to answer through experimentation. Students create their own experiment, then are given the materials to do their experiment, and then make conclusions based on their findings through the creation of a poster.
Subjects:
Grades:
9th - 12th, Higher Education
Types:
CCSS:
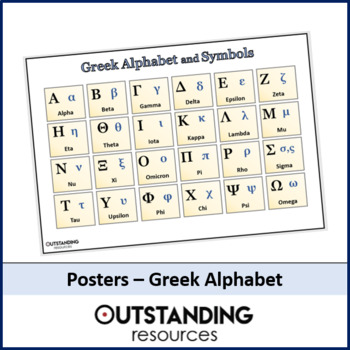
Greek Alphabet and Math Symbols Poster
This is a poster that shows the Greek Alphabet which highlights the impact they had on math and helps familiarise your students with their symbols. There is a strong link between the visual environment and visual props and retaining key facts or information.NOTE:1. Please provide a RATING with feedback2. Feel free to browse the Outstanding Resources shop for more excellent free and premium resources 3. Visit the Website, Facebook and Pinterest page for more exciting information, advice and disco
Subjects:
Grades:
7th - 12th, Higher Education
Also included in: Math Posters Bundle
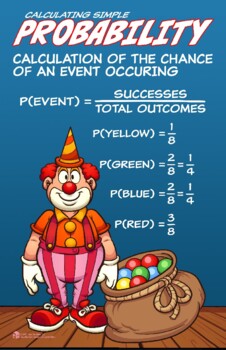
Simple Probability Poster
This 11 x 17 inch poster provides the definition and example of simple Probability.
Subjects:
Grades:
4th - 12th, Higher Education, Adult Education

Measure of Center: Mode Poster
This 11 x 17 inch poster provides the definition and example of the mode of a dataset.
Subjects:
Grades:
4th - 12th, Higher Education, Adult Education
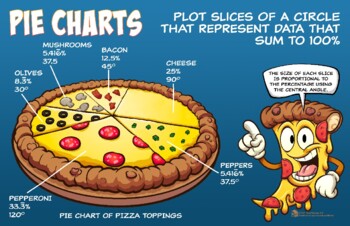
Pie Chart Poster
This 11 x 17 inch poster provides the definition and an example of a pie (circle) chart.
Subjects:
Grades:
5th - 12th, Higher Education, Adult Education
Showing 1-24 of 68 results


