3,762 results
Statistics projects for ESL-EFL-ELL
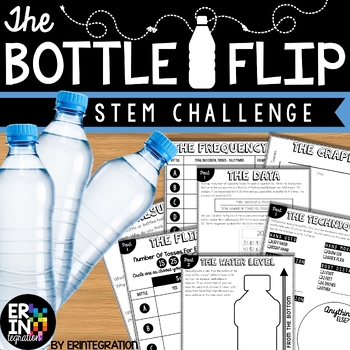
Water Bottle Flip STEM Challenge + STEM Activity
The ORIGINAL water bottle flip STEM activity and lab! Water bottle flip at school? Absolutely! Students will love this on-trend STEM challenge inspired by the popular YouTube water bottle flipping challenge where students toss a water bottle and attempt to land it straight up. Practice scientific method with some probability, fractions and data collection in the mix while having fun!This self-paced, low-prep, project based learning water bottle flip STEM challenge is print-and-go. Each activit
Subjects:
Grades:
3rd - 6th
Types:
CCSS:
NGSS:
K-2-ETS1-2
, K-2-ETS1-3
, MS-ETS1-2
, K-2-ETS1-1
, 3-5-ETS1-3
...
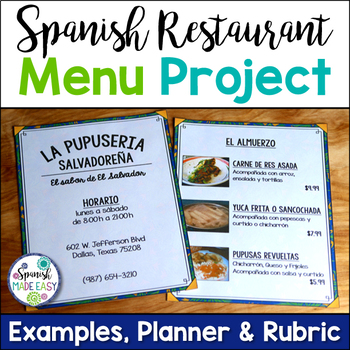
Spanish Restaurant Menu Project
This is a restaurant menu project for Spanish I. Students will design a restaurant menu that serves traditional Spanish dishes from a Spanish-speaking country of their choice. This project includes an introduction page with all the project requirements, 2 restaurant menu examples, a 2-page project planner/graphic organizer, and a grading rubric for student presentations.
Project Requirements:
* A menu cover with the restaurant name in Spanish, the days and hours of operation, address, and phon
Subjects:
Grades:
6th - 12th
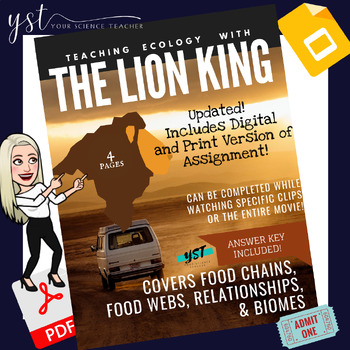
The Lion King - Food Chains & Webs, Relationships, & Biomes
**UPDATED TO INCLUDE BOTH DIGITAL (formatting updated as of 4/2024) AND PRINT VERSIONS and you can download the clips file if you don't want students to watch the entire movie** In this activity, students will be expected to watch either the entire Lion King movie or clips to complete the movie guide, which asks ecology related questions. Students will show their understanding of food chains, food webs, symbiotic relationships, and biomes as they watch a favorite movie through a science lens. Af
Subjects:
Grades:
3rd - 12th
NGSS:
HS-LS2-4
, HS-LS2-6
, HS-LS2-8
6th Grade Statistics Project: Analyzing Zombie Virus with Dot Plots and Mean
I created this project as a way for my 6th graders to practice their statistical skills. They loved it! They get to pretend to be epidemiologists studying a virus outbreak that is turning people into zombies. It's a fantastic way for students to see how statistics is used in the "real world" - they were also very interested to learn about the field of epidemiology. The Project: Students are given data about infected people who are quarantined in an airport. They are also given two maps of the US
Subjects:
Grades:
5th - 7th
Types:
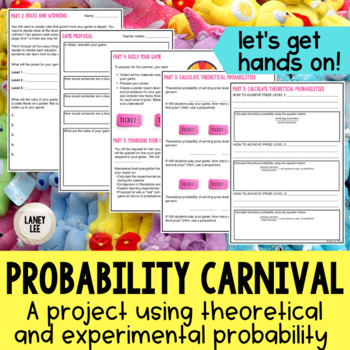
Probability Carnival Game Project - PDF & Digital
Looking for a fun, hands on way to bring probability to life? Are you ready to move past the "sit and get" style of whole group instruction? If you answered yes to either of those questions, then this resource is for you!Keep your students engaged and accountable with the interactive, versatile Probability Carnival! The steps of this project are designed to be rigorous and require students to predict, reflect, connect, and think critically about the situations being investigated.Using this proje
Subjects:
Grades:
6th - 8th
Types:
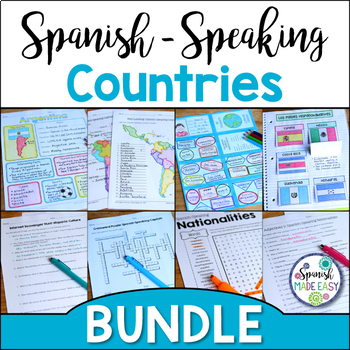
Spanish-Speaking Countries, Capitals, and Nationalities Bundle
This is a bundle of 15 resources over the 21 Spanish-Speaking Countries, Capitals, and Nationalities. In this bundle you will receive a Spanish-speaking country profile project, 2 map labeling activities, a matching quiz activity, 2 internet scavenger hunt activities, a 2 page coloring activity and a windsock craftivity with the 21 flags of the Spanish-speaking world, a passport mini booklet activity, an interactive notebook activity, 7 vocabulary activities, 3 vocabulary games, 2 grammar activi
Subjects:
Grades:
6th - 12th
Types:
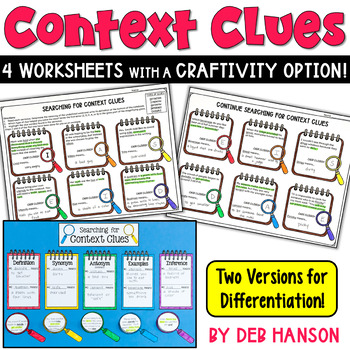
Context Clues Practice: Four Worksheets or Craftivity
Keep your students engaged as they use context clues to define underlined words within a sentence. The resource consists of four worksheets and an optional craftivity. Students also identify the five types of context clues, which include synonyms, antonyms, definition, inference, and examples.FOUR TRADITIONAL WORKSHEETS:This resource features two sets of worksheets! One set of two worksheets contains simpler words, and it is designed for middle elementary students or students who have limited la
Grades:
2nd - 5th
Types:
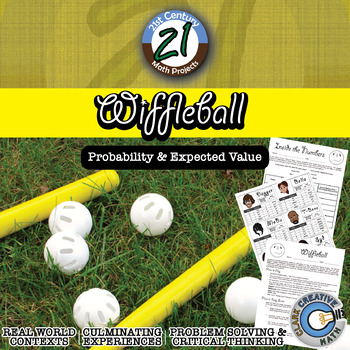
Wiffleball -- Theoretical & Experimental Probability - 21st Century Math Project
Theoretical and Experimental Probability gets a 21st Century Math Project facelift in this interactive game. Tired of flipping coins and spinning spinners? Students play the role of team managers and with only player statistics they must build a team capable of winning the championship. Students will plays a series of Wiffleball games where they will keep track of statistics using a baseball/softball inspired scorebook and after the game crunch the number to see if their players performed up to
Subjects:
Grades:
6th - 12th
Types:
Also included in: Probability & Expected Value Unit Bundle - Distance Learning Compatible
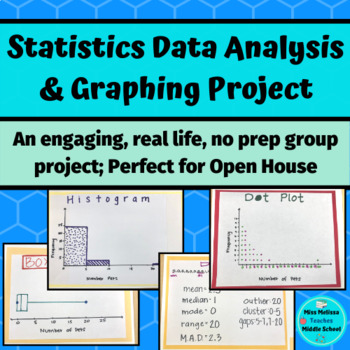
Statistics Project: Data Analysis & Graphing- real life, no prep
This statistics project is intended as a closure for your sixth grade statistics unit and aligns with ALL of the sixth grade statistics and probability common core state standards. In groups, students work together to choose a statistical question to ask the class. Once the class is surveyed, the group works together to create a frequency table, a dot plot, a histogram, and a box and whiskers plot. After creating their graphs, the groups analyze their data by looking at the mean, median, mode ra
Subjects:
Grades:
6th - 7th
Types:
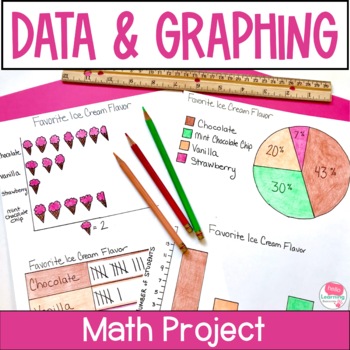
Data and Graphing Project - Real World Math Project Based Learning Activities
This data and graphing project gives your students a meaningful way to apply their data and graphing skills. Use this real world math project as an end of unit activity, enrichment activity or assessment. Easy to use and fun for students!Click the PREVIEW button above to see everything that is included in this fun math project!⭐ This resource includes:teacher information, directions and sample schedulesupply listgrading rubricstudent direction sheettwo data collection sheets (one for open ended
Subjects:
Grades:
4th - 6th
Types:
CCSS:
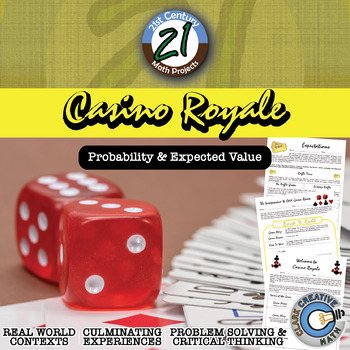
Casino Royale -- Expected Value & Probability Game - 21st Century Math Project
Your students might be begging for for a day for them to play games. Let it be on your terms in this 21st Century Math Project! This Expected Value and Probability Project focuses on one of the more emphasized aspects of the Common Core Standards. Students will be asked to design their own games with defined expected value and host it in a Game Day event! The student that collects the most "Swagg Cash" will forever (or at least for 36 hours) be known as the Master of Swagg. ***THIS PRODUCT HAS B
Subjects:
Grades:
6th - 12th
Types:
CCSS:
Also included in: Probability & Expected Value Unit Bundle - Distance Learning Compatible
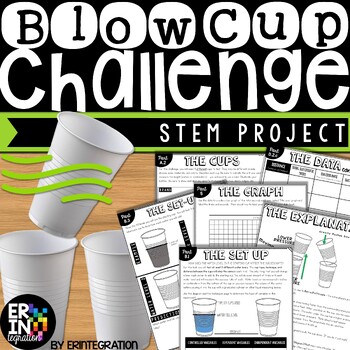
Blow Cup STEM Challenge and Scientific Method Project
The Blow Cup Challenge is now a STEM activity with this engaging science project inspired by the viral video where students try to blow one cup into another cup. Great low-prep way to teach the scientific method, variables and review math skills!This self-paced, multi-part Blow Cup STEM challenge is print-and-go. Each activity sheet guides students through the project. STEM Challenge Overview:Students will use the included visual directions, graphic organizers, charts, and activities to...Deter
Subjects:
Grades:
3rd - 6th
Types:
NGSS:
MS-PS2-2
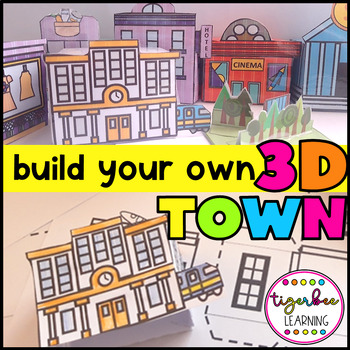
3D paper town project with 20 places in town
Build a mini town in your classroom using these printables 3D buildings.Students can use the town to practice everyday vocabulary, to give directions or to describe their town using prepositions of place. These are also great for community units and creating a model town. Just print, cut and glue and your town will be ready to explore! Included in this pdf:-20 color places in town-20 black and white places in town (students can color their town, their way!)-1 blank template for students to draw
Grades:
PreK - 6th
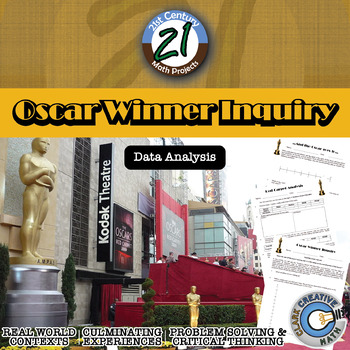
Oscar Winner -- Data Analysis & Statistics Inquiry - 21st Century Math Project
Utilize the last twenty years of Oscar winners as a data set to guide your students through creating box and whisker plots, histograms, and exploring mean, median, and mode -- in one 21st Century Math Project!Does the age of the award winning star in a film relate to the overall gross of the movie? Student will explore this inquiry question and use the data to support their conclusion.In this 8 page document you will be given a mapping to the Content Standards, an outline for how to implement t
Subjects:
Grades:
6th - 12th
Types:
ESL Hero Research Project Paragraph Writing and Oral Presentation
In this week-long project, Beginner to Intermediate ESL students write about and present their heroes. Their hero can be someone in their personal lives, like a family member, someone who is from their country, or someone who is well-known internationally. First, students read a text about Jesse Owens and identify the topic sentence, details, examples and concluding sentence. Students deconstruct the Jesse Owens paragraph in order to help them in writing their own paragraphs. Then, they conduct
Subjects:
Grades:
3rd - 11th
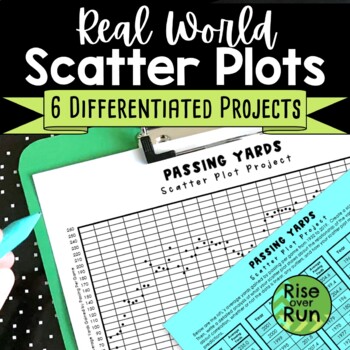
Scatter Plot Project with Real World Sports Data
Practice creating and analyzing scatter plots with these six differentiated real world projects. Students are provided statistics for a sport and must graph the data. Then, they write an analysis describing correlation, whether or not the data is linear, any outliers, and how the scatter plot might be used to make predictions. The scatterplots range from 38 points to 149 points, so they can be used to differentiate. The scatter plots will take a little time to plot, but they result in real
Subjects:
Grades:
8th - 9th
Types:
CCSS:
Also included in: 8th Grade Math Activities & Lessons Bundle for the Whole Year
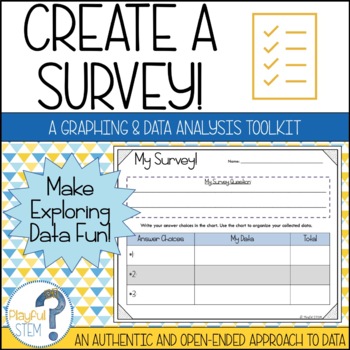
Create Your Own Survey: Collect, Organize, Graph, and Analyze Data
One of my best-selling TPT products -- now updated with a fresh look and new content!Teach Data Analysis the open-ended and engaging way -- through student-directed surveys!This resource pack is designed to help students follow the process of creating a survey: they will brainstorm questions, collect data, organize their obtained data, create multiple graphs to show their data, and then reflect on and analyze what their data tells them.The survey pack includes the following:Brainstorming Survey
Subjects:
Grades:
2nd - 5th
Types:
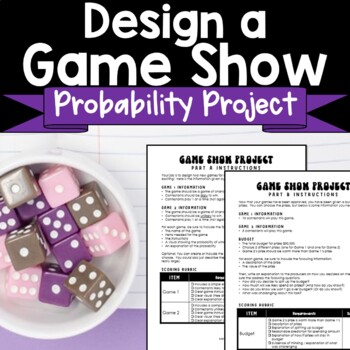
Probability Project Design a Gameshow Game
Look for fun probability activities? Students get creative as they design games for gameshows in this engaging project about simple and compound probability! Instructions are included to guide students in completing the following:Design a game based on a simple eventDesign a game based on a compound eventExplain the probabilities of winningChoose prizes based on a budget and probabilities of winningThe project is split into 2 parts with a rubric for grading each one.You might provide students so
Subjects:
Grades:
7th - 10th
Types:
Also included in: 7th Grade Math Activities, Lessons, Projects & More Bundle
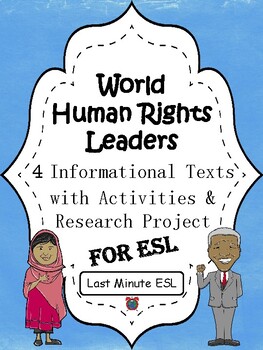
4 World Human Rights Leaders Biographical Articles with Activities for ESL
In this ready-to-go biographical article, activity, and research project mini-unit bundle about world human rights leaders - Malala, Martin Luther King Jr., Nelson Mandela, and Gandhi - beginner to intermediate ESL students practice reading and responding to informational texts. These texts can be used for an in-class activity, homework, or an emergency sub plan. As a final, project-based assessment students conduct internet research and present on a hero of their choice (see details below). I d
Grades:
3rd - 11th
Types:
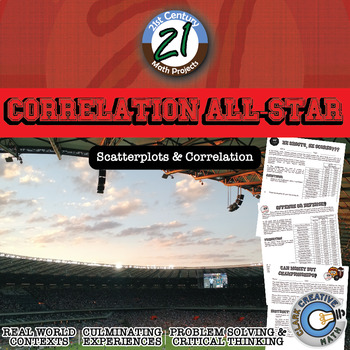
Correlation All-Star -- Sports Data Analysis - 21st Century Math Project
Bring an authentic sports-based math project to your Algebra, Algebra 2 or PreCalculus classroom with Lines of Best Fit and Correlations! All in this 21st Century Math Project! Using data from the MLB, NBA, NFL and NHL students investigate correlations to some of sports most common questions like: "Do more shots result in more goals?" "Do hitters or pitchers have more impact on a team's wins?""What NFL stat is most strongly correlated with wins?" and the grand-daddy..."Can money buy championship
Subjects:
Grades:
7th - 12th
Types:
CCSS:
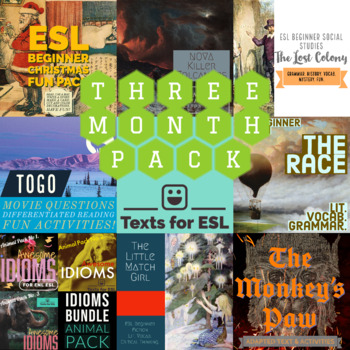
3 Month Pack - ESL Beginners + Intermediates! Readings, Activities, Vocab, Fun!
Make your year a little easier, and give your ELL students high quality, high interest, fun materials! If you covered everything in this pack it would probably take around 70 school days. That's a lot of material for your school year -- nearly 4 months!Many of these 30+ resources work with multiple levels and work on both paper and online (via TpT's digital platform they can be assigned straight to Google Classroom). Some are specifically for newcomers / beginners, some are for intermediate stud
Subjects:
Grades:
6th - 12th, Adult Education
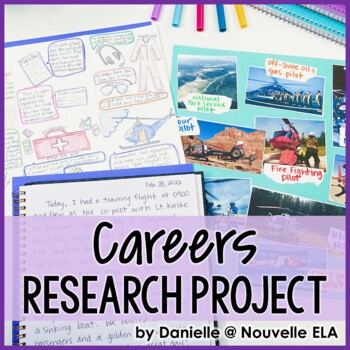
Careers Exploration Research Project - Building Research Skills - Portfolio
In this career explorations research project, students research a career. They present their findings in a research portfolio: a variety of creative written and artistic projects, including writing a resume. This process develops important research skills like evaluating sources, citing and paraphrasing evidence, and analyzing claims. Students are engaged and excited as they present their results in an alternative to a formal paper.✅ High Engagement Activity✅ Editable and Differentiated✅ Paper o
Grades:
6th - 9th
Types:
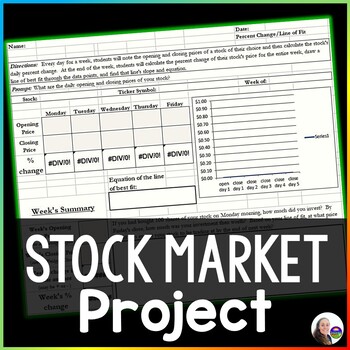
Stock Market Math Project | Build Personal Financial Literacy
This stock market project asks students to follow a stock of their choice for a week, calculate the daily and weekly percent change in price, estimate a line of fit for their scatter plot, find the slope and equation of their line of fit and write a final analysis of their data. The project is editable so you can customize as you need to for your students. Also now includes a link to a Google Sheet version for online learning.The final spreadsheet is formatted with formulas that automatically ca
Subjects:
Grades:
7th - 9th
Types:
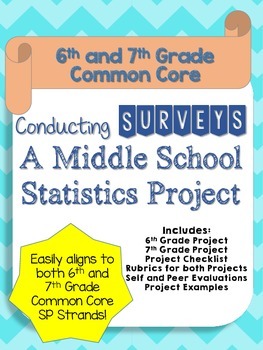
Statistics Project
This is a survey project that is aligned to the 6th and 7th Grade Common Core (6.SP.1 to 6.SP.5 and 7.SP.1 to 7.SP.4). Students survey a random sample and then calculate the mean, median, range, and mode of the data. They also must create different data displays such as histograms and box and whisker plots. This project is an all encompassing activity that gets students thinking about statistics and loving math! They prove their understanding of the topics by asking questions they are interested
Grades:
6th - 7th
Types:
Showing 1-24 of 3,762 results


