223 results
10th grade Common Core 8.SP.A.1 resources

Oscar Winner -- Data Analysis & Statistics Inquiry - 21st Century Math Project
Utilize the last twenty years of Oscar winners as a data set to guide your students through creating box and whisker plots, histograms, and exploring mean, median, and mode -- in one 21st Century Math Project!Does the age of the award winning star in a film relate to the overall gross of the movie? Student will explore this inquiry question and use the data to support their conclusion.In this 8 page document you will be given a mapping to the Content Standards, an outline for how to implement t
Subjects:
Grades:
6th - 12th
Types:
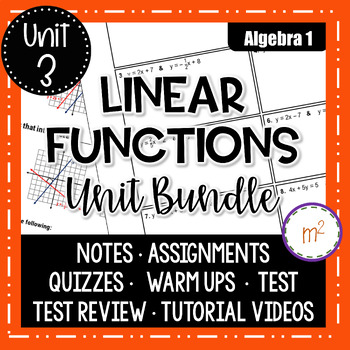
Linear Functions Unit (Includes Linear Regressions) - Algebra 1 Curriculum
20 DAYS of GRAPHING and WRITING Linear Functions AND Scatter Plots and Trend Lines! With 20 days of Linear Functions and Equations, this large unit covers ALL aspects of the most heavily tested Algebra 1 function.The Linear Functions Unit has been updated with a fresh look, new answer keys, a variety of options and now includes a Google Forms and TPT Easel version of the unit test!THE LINEAR FUNCTIONS UNIT INCLUDES:15 lessons and assignmentsonline tutorial videos 2 quizzes (A & B versions e
Subjects:
Grades:
8th - 10th
Types:
Also included in: Algebra 1 Curriculum Fall Semester Bundle
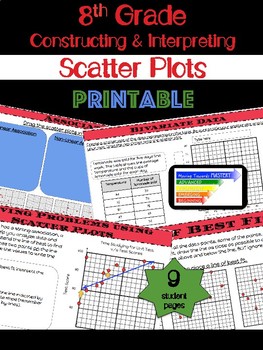
8th Grade Math Constructing & Interpreting Scatter Plots
Extensive printable lessons for constructing and interpreting scatter plots.The lessons are scaffolded to build understanding. Students will progress from identification of terms to making predictions involving bivariate data. The guided lessons will begin with identification, move towards assisted analysis, and conclude with independent practice.Lessons include...♦ Definitions and Visual Representations♦ Identification and Use of Terms → Bivariate Data → Scatter Plot → Linear, Nonli
Subjects:
Grades:
8th - 10th
Types:
CCSS:
Also included in: 8th Grade Math Common Core Growing Bundle
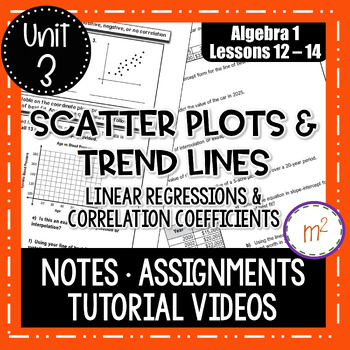
Scatter Plots and Trend Lines (Linear Regressions) - Algebra 1
Algebra 1 Notes and Assignments over Scatter Plots and Trend Lines. TUTORIAL VIDEOS included (no prep to you!) and can be found on my YouTube Channel: mandy’s math world - the videos are on the Linear Functions Unit Playlist! This product includes THREE days of lessons and assignments. Day 1 introduces scatter plots, positive/negative/no correlations, and making predictions by interpolating and extrapolating data. Students will identify general correlations, draw trend lines and make predictio
Subjects:
Grades:
8th - 11th
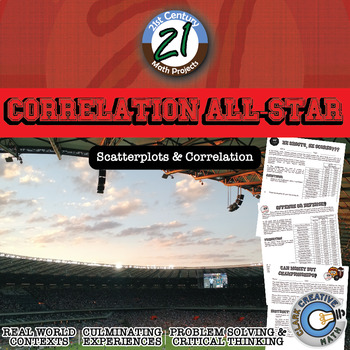
Correlation All-Star -- Sports Data Analysis - 21st Century Math Project
Bring an authentic sports-based math project to your Algebra, Algebra 2 or PreCalculus classroom with Lines of Best Fit and Correlations! All in this 21st Century Math Project! Using data from the MLB, NBA, NFL and NHL students investigate correlations to some of sports most common questions like: "Do more shots result in more goals?" "Do hitters or pitchers have more impact on a team's wins?""What NFL stat is most strongly correlated with wins?" and the grand-daddy..."Can money buy championship
Subjects:
Grades:
7th - 12th
Types:
CCSS:
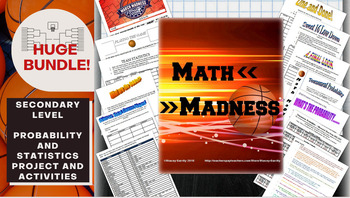
Math March Madness Full Tournament Project {BUNDLE}
Harness the excitement of NCAA March Madness with this huge project for secondary math teachers that follows all stages of the tournament! This Common Core aligned bundle comes with bonus parts not sold individually in my store so you can create a rich immersion in the tournament, practice probability and statistics and learn some interesting new ones along the way! Save $3 plus get bonus content by bundling!You can pick and choose which parts you would like to incorporate, or follow my schedu
Subjects:
Grades:
6th - 12th, Higher Education
Types:
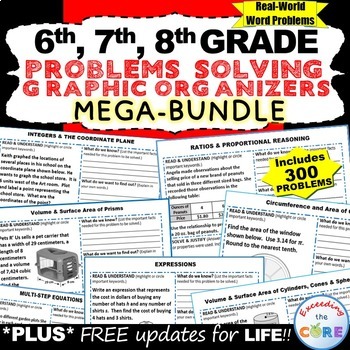
6th, 7th, 8th Grade Math PROBLEM SOLVING GRAPHIC ORGANIZER BUNDLE : end of year
This middle school math BUNDLE includes 35 sets (350 problems) of 6th, 7th and 8th grade real-world COMMON CORE WORD PROBLEMS that students must solve and explain using problem-solving strategies. An ANSWER KEY has also been provided with examples of possible answers. Be sure to download the sample for a full overview of what you get.I created this problem-solving graphic organizer for my students who struggle solving WORD PROBLEMS and are unable to explain their work/solution. Each worksheet p
Subjects:
Grades:
6th - 10th
Types:
Entire Math Curriculum Bundle (All Math Resources)
⭐ This bundle includes ALL of my Math Curriculum in my Teachers Pay Teachers store ⭐You will be receiving ALL of my 6th, 7th, and 8th Grade Math interactive notebooks, activities, foldables, practice worksheets, warm-ups, exit slips, assessments, and much more! This is well over 1000 pages of material that I have created to help make math more enjoyable to students. My material also helps students to make connections to the real world.In addition to all of the math material in my store, you will
Subjects:
Grades:
5th - 10th
Types:
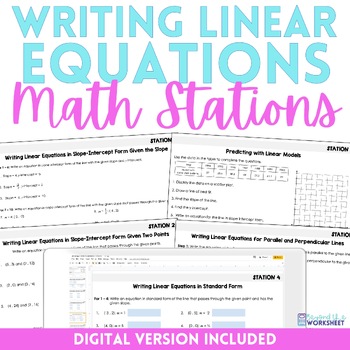
Writing Linear Equations Math Stations | Math Centers
⭐️⭐️⭐️ This set of math stations allow students to practice writing linear equations in a variety of forms. ✅ Stations Included: Writing Linear Equations in Slope Intercept Form Given the SlopeWriting Linear Equations in Slope Intercept Form Given Two PointsWriting Linear Equations in Point Slope FormWriting Linear Equations in Standard FormWriting Equations of Parallel & Perpendicular LinesPredicting with Linear ModelsAnswer keys are included.❤️ A digital version is included as well! Avail
Grades:
7th - 10th
Types:
Also included in: Middle School Math Activities Bundle
8th Grade Statistics Project- Scatter Plots: Analyzing Asthma
I created this project as a fun way for my 8th grade students to apply their knowledge of scatter plots in a meaningful way. They had a lot of fun!Students pretend to be biostatisticians investigating why asthma rates in a city are skyrocketing. Students get to uncover the environmental cause of the increased rates of asthma and investigate how different factors are associated with asthma attacks.Students get lots of practice: - creating scatter plots using a table of data- selecting an appropri
Subjects:
Grades:
8th - 10th
Types:
CCSS:
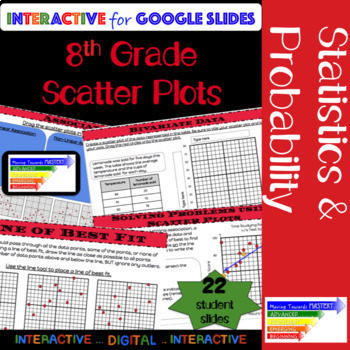
8th Grade Math Scatter Plot: Guided Interactive Lesson
Extensive ALL digital guided lesson for constructing and interpreting scatter plots.The slides are scaffolded to build understanding. Students will progress from identification of terms to making predictions involving bivariate data. The guided slides will begin with identification, move towards assisted analysis, and conclude with independent practice.Slides include...♦ Definitions and Visual Representations♦ Identification and Use of Terms→ Bivariate Data→ Scatter Plot→ Linear, Nonlinear, &
Subjects:
Grades:
8th - 10th
Types:
CCSS:
Also included in: 8th Grade Math Common Core Growing Bundle
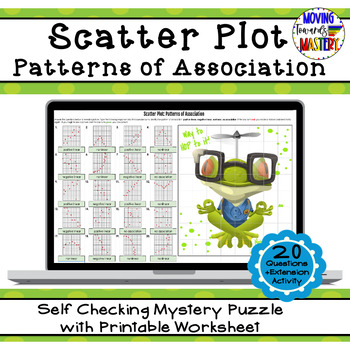
Scatter Plot: Patterns of Association Self Checking Mystery Picture
Engaging math self checking review activity to practice identifying patterns of association for scatter plots.This self-checking activity will allow students to practice identifying patterns of association for scatter plots. Students will use their understanding of scatter plots to answer questions to reveal pieces of a mystery puzzle as they work, just like a pixel art activity! If students answer incorrectly, the box will turn red and NO picture pieces will be revealed. This resource include
Subjects:
Grades:
7th - 10th
Types:
CCSS:
Also included in: 8th Grade Math Common Core Growing Bundle

Statistics Survey Project - Project Based Learning (PBL) with Math
Watch your students dive into the world of math as they create, execute, and analyze their own survey! Students will demonstrate mastery of data gathering, survey sampling, developing appropriate survey questions, data tables, Direct Variation, discrete graphs, dot plots, box and whisker graphs, and calculating the inter-quartile range.The Unique Survey Project is highly engaging, capitalizing on the innate curiosity of the adolescent mind. You will love the low-prep instructional guide. Your st
Subjects:
Grades:
6th - 10th
Types:
Also included in: Fun with Ratios Activities Bundle - 7th Grade PBL with Math
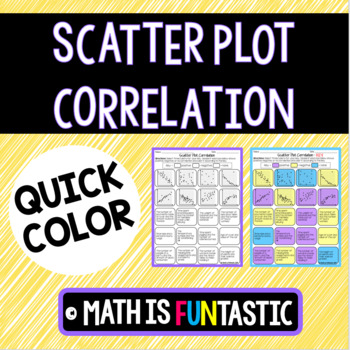
Scatter Plot Correlation Quick Color
This ready to use product is a quick, fun way to have your students practice identifying positive, negative, and no correlation in scatter plots. Students will be given 20 different problems (graphs and verbal descriptions) and will need to classify it as positive, negative, or no correlation. Instead of writing their answers, students will color them! You can either choose the colors for them to make it unified across the classroom or let them choose their own. This is an extremely easy assignm
Subjects:
Grades:
7th - 10th
Types:
CCSS:

42 Blank Graph Templates: Horizontal & Vertical Bar Graph, Line Graph, Printable
Looking for an array of printable graph templates for all your future bar and line graph needs? Look no further! With 42 different templates ranging for bar graphs, to line graphs, varying in X values and Y values, this combination should be the last graph download you need to worry about for your class. These graphs can even be used as Histograms, Dot Plots, Scatter Plots, or a variety of other graphs to suit the needs of your classroom.I created this template to require all the basics of gr
Grades:
4th - 12th
Types:
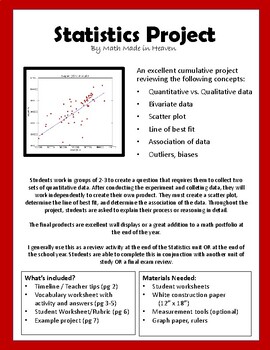
Statistics Project: scatter plot, line of best fit, association of data
An excellent cumulative project reviewing the following concepts: •Quantitative vs. Qualitative data•Bivariate data•Scatter plot•Line of best fit•Association of data (strong, weak, linear, non-linear, positive, and negative)•Outliers, biases, population, sample groupStudents work in small groups to create a question that requires them to collect two sets of quantitative data. After planning and conducting the experiment and collecting data, they will work independently to create their own produc
Subjects:
Grades:
7th - 10th
Types:
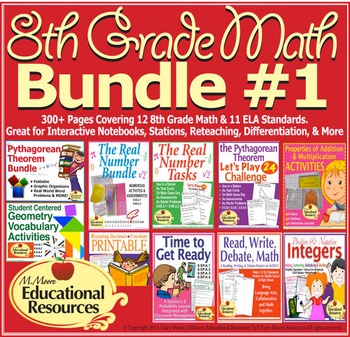
8th Grade Math - Bundle #1 - Activities for Interactive Notebooks & More
★ Start your Math Units with these Engaging visual math tasks and activities to teach your 8th grade math curriculum or as a review with 9th Grade math students! Perfect for Interactive Notebooks, Stations, Cooperative Learning, Differentiation, & MORE!
★ Save $$$ by purchasing this bundle of 8th Grade Activities! Purchasing the products separately would be over $96.00.
This product may be used for any 8th grade classroom or for reteaching/review in 9th grade math. Whether you are using
Subjects:
Grades:
7th - 10th
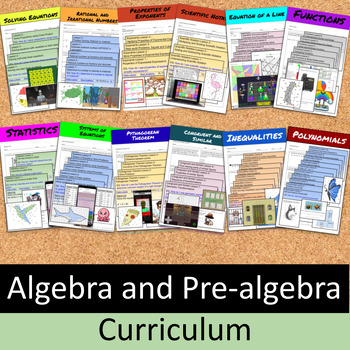
8th Grade Math-Algebra and Pre-Algebra Whole Course Growing Bundle
This bundle contains:All 65 lessons each has a lesson file in Google Slides, a lesson practice/homework, and a full length video of me teaching the lessonAll assessments for each of the unitsAll activities for all of the units.All 8th grade State Test prep activitiesTHIS IS A GROWING BUNDLE! All new resources will be continually added to this bundle so the sooner you purchase, you will get the best deal. You will get the lowest price, and all future resources are added for free! Save a massive 3
Grades:
7th - 10th
Types:
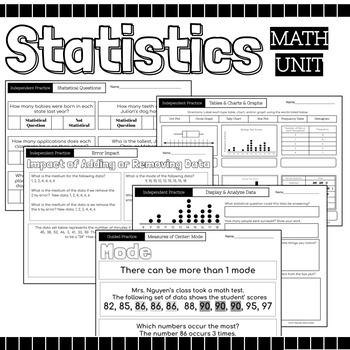
Statistics Math Packet {Data, Charts, Graphs, Mean, Median, Mode, Range, Spread}
52 Page Statics Unit Includes: Guided Instruction & Independent Practice Pages Usage Suggestions and IdeasThis resource can be utilized in numerous ways, here are some ideas:use for guided practiceassign as partner workassign as independent practicecan be used for morning workuse for reteaching in small group settinguse as review prior to assessmentuse as review in continuing to strengthen skillassign for homeworkuse as independent work during math centersTopicsRecognize Statistical Question
Subjects:
Grades:
4th - 12th
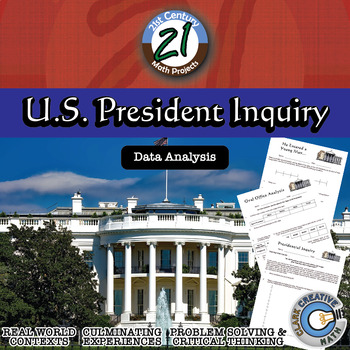
U.S. President -- Data Analysis & Statistics Inquiry - 21st Century Math Project
Engage students in data analysis through use of Presidential data in this 21st Century Math Project. Students will create box and whisker, stem and leaf, histograms and scatterplot through their investigations. In the end, students will take on the inquiry question: "Do US Presidents with the most children live longer after they have been inaugurated?" ***THIS PRODUCT HAS BEEN UPDATED WITH A GOOGLE SLIDES INTERACTIVE VERSION INCLUDED. REDOWNLOAD IF YOU HAVE IT ALREADY***-- In "He Entered a Youn
Subjects:
Grades:
6th - 12th
Types:
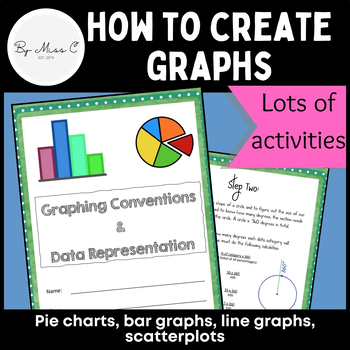
Guide to graphs: Pie charts, bar graphs, line graphs, scatterplots + activities
This is a fantastic resource for introducing students to graphing and data representation. This booklet will take students through the uses for particular graphs and how to construct them. At the end of each module, there are activities for students to complete, to practice their graphing skills. Answer key is included, making this a no-prep activity. This booklet covers: - why we visually represent data- pie charts and how to create them - bar graphs and how to create them - line graphs and how
Subjects:
Grades:
6th - 12th, Higher Education, Adult Education
Types:
CCSS:
Linear Functions Unit with Activities Bundle Algebra 1 Curriculum
With 20 days of Linear Functions and Equations, this large unit covers all aspects of the most heavily tested Algebra 1 function. Enhance your unit with a variety of activities, including Boom Cards, Google Slides activities and printables! Additionally, spiral previously learned concepts with three spiral review assessments (quick checks)!GENERAL INFORMATION:THE LINEAR FUNCTIONS CURRICULUM UNIT INCLUDES:15 lessons and assignmentsonline tutorial videos 2 quizzes (A & B versions each)16 warmu
Subjects:
Grades:
8th - 11th
Types:
Measures of Center & Variance Unit Bundle - Distance Learning Compatible
This is a selection of my Measures of Center & Variance resources all in a money saving Essential Bundle! You save significant money and time versus purchasing these separately!Essential Bundles are designed to give you everything you need to rock your unit. Warmups, Notes, Activities, Games, Exit Tickets, and Tests. You will find a selection of my Drive Instruction, Escapes, Boot Camp, Adventures, Whodunnits, CSI, Person Puzzles, STEM-ersions, Herowork, TableTop and my 21st Century Math Pro
Subjects:
Grades:
6th - 12th
Types:
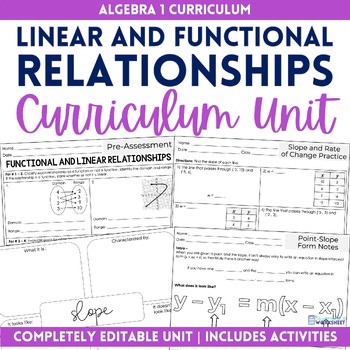
Linear and Functional Relationships Unit Algebra 1 Curriculum
Algebra 1 Unit - Linear and Functional Relationships. Completely editable to help you best meet the needs of your students! ⭐️⭐️⭐️ This MASSIVE unit includes seven multi-day lessons that cover the following skills:Identifying and Evaluating FunctionsCalculating SlopeGraphing Linear Relationships Using Tables and Slope-Intercept FormGraphing Linear Relationships Using Intercepts and Point-Slope FormParallel and Perpendicular LinesGraphing Linear Equations ApplicationsScatter Plots and Line of Be
Subjects:
Grades:
7th - 10th
CCSS:
Also included in: Algebra 1 Curriculum: Comprehensive, Engaging & Standards-Aligned
Showing 1-24 of 223 results

