2,186 results
10th grade graphing microsofts
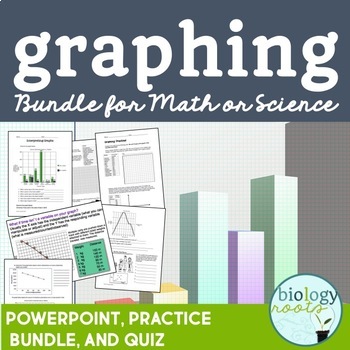
Graphing Bundle for Secondary
Complete and editable graphing bundle includes plenty of practice, editable PowerPoint notes to introduce or reinforce graphing concepts, as well as an assessment to finish it off! Suitable for grades 7 and up. Included in the package is:1. How to Interpret Graphs PowerPoint PresentationCovers line graphs, bar graphs, scatter plots and pie charts. Answers included on teacher version.Student notes included (PDF and PPT). 2. Interpreting Graphs- 3 pages of graph interpretation in which students an
Subjects:
Grades:
6th - 10th

Beaker Pong: Experimental Design and Graphing Lab, NGSS aligned
Great 1st week or 1st month STEM activity! All parts are EDITABLE and includes a graphing grid! This is a great way to introduce the "science process" (better phrase for scientific method) at the start of a semester or anytime you want fun to occur in your classroom.*****Focus on the NGSS PRACTICES Dimension*****The National Research Council's (NRC) Framework describes a vision of what it means to be proficient in science; it rests on a view of science as both a body of knowledge and an evidenc
Subjects:
Grades:
7th - 12th
Types:
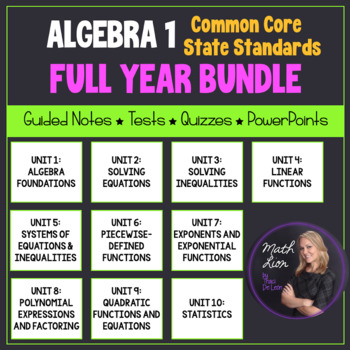
Algebra 1 Curriculum - Full Year EDITABLE Unit Plans | Bundled for Common Core
This is a great bundle that covers concepts for a full year Algebra 1 course! 76 lessons are included! Documents are EDITABLE!Included:- Overview of the common core alignment tandards (Two 18-week guides) (PDF and Word) - Overview of the common core alignment (PDF)- Guided notes for 76 lessons (PDF and Word)- PowerPoint presentations (aligned with guided notes) (PPTX)-10 Mid-unit quizzes (PDF and Word)-10 Unit tests (PDF and Word)-2 Semester exams (PDF and Word)Each lesson contains a learning
Grades:
8th - 12th
CCSS:
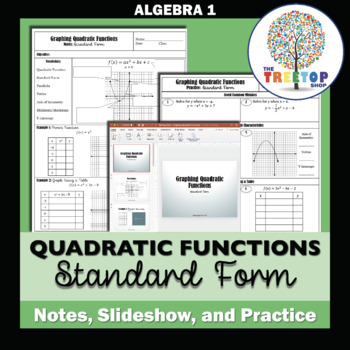
Graphing Quadratic Functions (Standard Form) - Notes, Slideshow, and Practice
Students will:-Identify key features of graphs of quadratic functions.-Graph quadratic functions in standard form using a table of values.-Graph quadratic functions from standard form by finding the axis of symmetry, vertex, and y-intercept.Includes everything you need to teach this lesson in one folder:-PDF of guided notes (with key)-Editable PowerPoint and Google Slide presentation for use with guided notes-PDF of practice problems (with key)Copy the guided notes for students and present the l
Subjects:
Grades:
9th - 12th
CCSS:
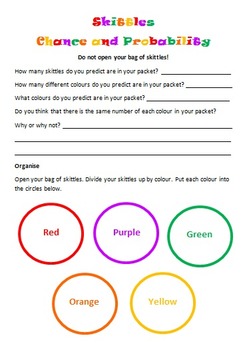
Skittles Chance and Probability (Editable)
Chance and Probability activity using yummy Skittles!!!
Students are to predict the colours and quantities before they open the skittles bag. Students are to complete a chance experiment where they use a tally to collect their data. Students then transfer their data in fractions, decimals and percentages. Students are to create a bar graph using their data as well as answer chance and probability questions about the data. I used this with my grade 5/6 students and they loved it!
Subjects:
Grades:
3rd - 10th
Types:
Geometry PowerPoint Lessons for the Entire Year BUNDLE
Teachers, save yourself time creating lessons! These fully editable PowerPoint lessons are professionally designed and teach students the important concepts throughout the Geometry course. Each lesson has 3-20 slides which are animated for continued student engagement.Why purchase the bundle?You get the best deal! You pay $60 for what is worth $96! BIG SAVINGS!Teaching virtually? Face to face? Both?Record your voice directly onto the slides and send the file to your students to watch at home as
Grades:
8th - 10th
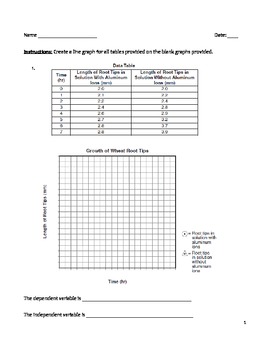
High School Science Graphing Worksheet - Making Line Graphs in Science
Use this worksheet to help your students practice making line graphs. In addition, they will have to identify both the independent and dependent variables. Hopefully, they will make the connection between the variables and their placement on the graph. There is a key provided for the teacher. There are ten line graphs for students to work with.
line graph, plot points, independent variable, dependent variable, data table, uniform scale, x-axis, y-axis
Subjects:
Grades:
8th - 12th
Types:
Blank Bar Graph/Double Bar Graph Template
This is a bar graph template that can be used by teachers to teach students how to understand bar graphs and create their own bar graphs. Teachers can use this template teach students about parts of a bar graph and how to interpret data in bar graphs.
Grades:
1st - 12th
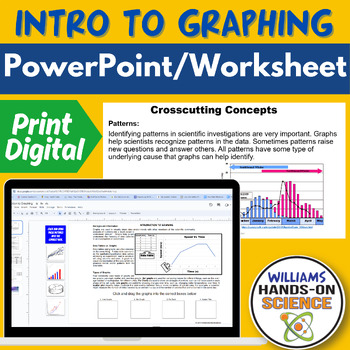
NGSS Intro to Graphing Crosscutting Concepts Science & Engineering Practices
If you are teaching your students how to understand graphs and want to hit NGSS Science and Engineering Practices and Crosscutting Concepts, this resource is a great scaffold or lecture! This resource is great as a warm up/bell ringer, lecture, homework or sub plan.This resource includes the following:-Student Handout-Key-Editable PowerPoint for lecture and/or scaffold This resource includes the following Concepts:-Interpreting Graphs-How to make a graph-Difference between data tables and graph
Subjects:
Grades:
6th - 12th
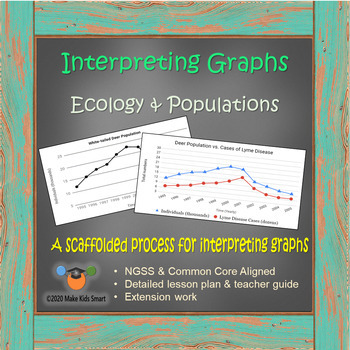
Interpreting Graphs - Ecology & Populations (17 slide Distance Learning Packet)
Teach students how to analyze and interpret line graphs, describe trends, and discuss data using a proven 5-step process. This is 2-3 periods of work suitable for distance learning and meant to move gradually from teacher led to independent work.All materials are found within this 17 page editable power point which is suitable for distance learning. Slides can be shared individually for student completion or shared as a full packet.Please check the preview to see exactly what you are downloading
Subjects:
Grades:
6th - 12th
NGSS:
HS-LS2-7
, MS-LS2-2
, MS-LS2-5
, HS-ESS3-2
, MS-LS2-4
...
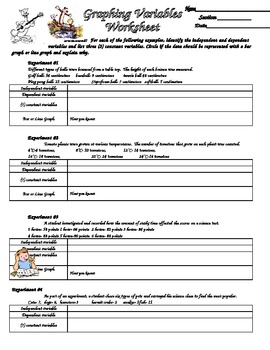
Scientific Method Variables and Graphing Practice
Students are given six different sets of experimental data and asked to identify the variables (independent, dependent etc.). They also reinforce graphing by identifying if the data should be represented with a bar or line graph. With this information, students the create data tables and graphs for the data.
Subjects:
Grades:
3rd - 12th
Types:
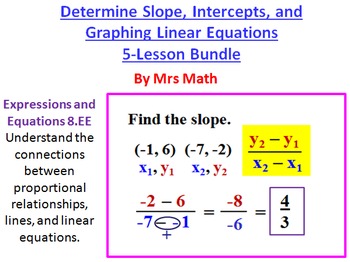
Slope, Intercepts, and Graphing Linear Equations Power Point 5 Lesson Pack
PDF and Microsoft word versions included.Are you looking for an all inclusive package that has everything you need to teach finding the slope, intercepts, and graphing equations? This is it! Lesson Power Points, classworks, homeworks, quizzes, a set of test questions, and even some teaching tips embedded in the lesson for instruction. If you are teaching this topic from scratch these resources will be a lifesaver. They can also be an excellent supplement to the resources you are already usin
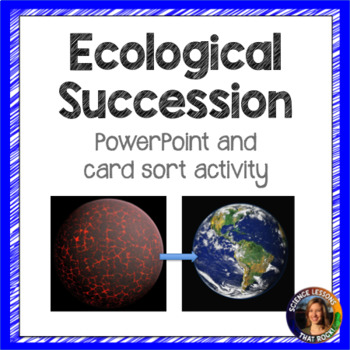
Ecological Succession
In this lesson, students will learn about ecological succession and the differences between primary and secondary succession. Included in your purchase:- An 18 slide powerpoint presentation - A 3 page card sorting activity (both printable PDF version and digital Google slide version included)- A guided YouTube lesson that walks students through the powerpoint. Great for blended learning, flipped classroom models, or absent students.You might also be interested in:Ecological succession timeline a
Subjects:
Grades:
8th - 10th
Types:
Also included in: Ecology Bundle
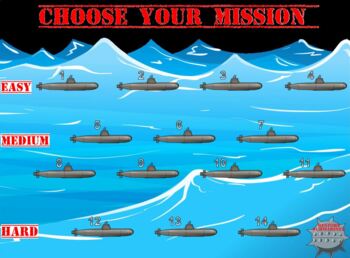
Coordinate Battleship for Graphing Ordered Pairs
UPDATES:Thank you for your feedback! Based on your suggestions, I've made the following changes for this version (version 2):1. You can now choose between EASY, MEDIUM, and HARD modes. For easy mode there are no gaps between hits. For medium mode there are gaps but the hits are evenly spaced. For hard mode, hits are randomly spaced.2. There's now a button that will reveal/hide submarines. You can use this as another tool for hints to students or you can reveal the submarine once students
Grades:
6th - 10th
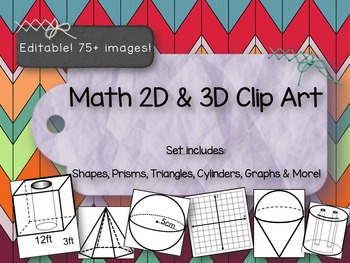
Clip Art Shapes -2D & 3D Prisms, Graphs, Cylinders and more! PPT File
One of the teachers at my school was having trouble finding some 3D geometric shapes to make her test with, so I made a few for her. Then one thing led to another, and now I have a whole bunch of clip art that I thought a Math teacher might find useful. I have used these images to create tests, task cards, scavenger hunts, and practice work for Math small group and centers.
This file is not meant to be used as a presentation. The idea is that you can copy/paste whatever you need from here a
Subjects:
Grades:
5th - 10th
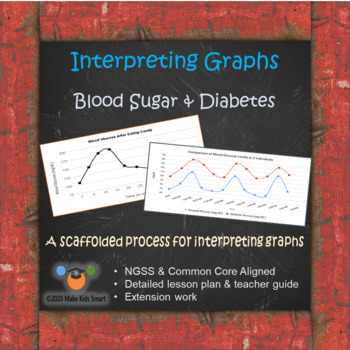
Interpreting Graphs - Blood Sugar & Diabetes (15 slide Distance Learning PPT)
Teach students how to analyze and interpret line graphs, describe trends, and discuss data using a proven 5-step process. This is 2-3 periods of work suitable for distance learning and meant to move gradually from teacher led to independent work. All materials are found within this 15 page editable power point which is suitable for distance learning. Slides can be shared individually for student completion or shared as a full packet.Please check the preview to see exactly what you are downloa
Grades:
6th - 12th
CCSS:
NGSS:
MS-LS1-2
, MS-LS1-3
, HS-LS1-2
, HS-LS1-3
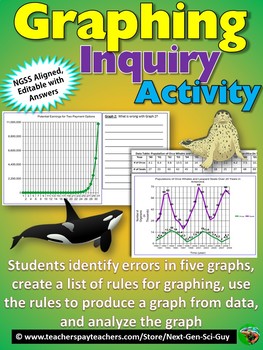
Graphing Inquiry Activity: NGSS Graphing and Data Analysis: Distance Learning
This activity proceeds as follows:1. Students are given a hypothetical scenario in which they are offered two different payment options for house-sitting a wealthy neighbor's house, and have to fill in a data table by calculating the earnings for each option 2. Students then evaluate five different graphs, each of which incorrectly represents the data in some way. They must find the mistakes.3. Students then generate a list of rules for proper graphing4. Students use their rules, and data on or
Grades:
7th - 12th
Types:

The Scientific Method-Red-Nosed Reindeer Mystery-Christmas-Powerpoint
Follow Roger the elf as he applies the Scientific Method to question the origin of the red-nosed reindeer.
Terms/Topics covered in this presentation include: The Seven Steps of the Scientific Method, How to Applying the Scientific Method, hypothesis, variables, controls, data, Recording and Analyzing Data, Data tables, Graphing, Drawing Scientific Conclusions, and hidden variables.
This would be a great review, but can also be a stand alone lesson. Aside from providing an entertaining a
Subjects:
Grades:
4th - 12th
Create Population Pyramids!
OverviewStudents will understand how to read a population pyramid by creating one! This activity includes two templates to help your students create their own population pyramids, as well as population data for four countries from the U.S. Census Bureau's International Database. The activity includes blank cards if you or your students would like to create additional or specific population pyramids. Instructions are included to help navigate the U.S. Census Bureau's website in order to obtain th
Grades:
6th - 12th
Types:
Speed Velocity Acceleration and Graphing Worksheets
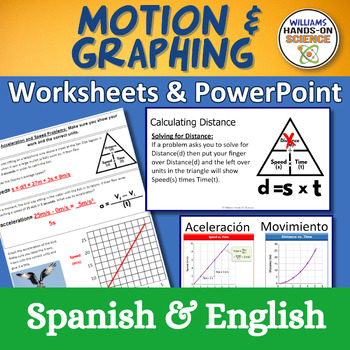
Check out these hassle-free self-paced exercises on Speed, Distance, Time, Acceleration, and Graphing! This ready-to-use resource requires no preparation, offering students engaging problems to solve independently. Enhance the learning experience with an accompanying PowerPoint presentation that guides students through the worksheets effortlessly. Plus, enjoy the added convenience of Spanish versions for both the worksheets and PowerPoint. Elevate your classroom experience with this comprehensiv
Subjects:
Grades:
8th - 10th
NGSS:
MS-PS2-2
Editable Student Goal Tracking Book
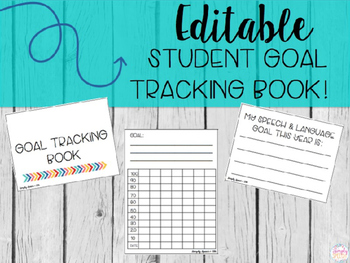
These mini goal books are the perfect way to help your students keep track of their own goals. These books help increase student motivation and self awareness as they create their own personal goals and track their own progress.Here's what's included:Page 3: cover page options. This page is editable. Click on 'add text box' to add your students' names to their books.Page 4: Goal tracking sheets. Print as many of these pages as you need. This is also editable if you wish to type the goals in. Pag
Subjects:
Grades:
1st - 12th
Pasta Activity - An Introduction to Graphing Sine and Cosine
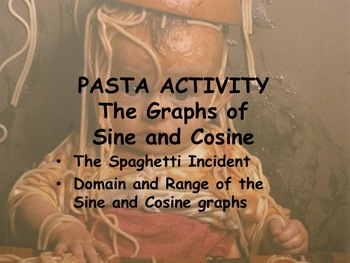
This activity introduces graphing sine and cosine functions in a fun way! By using uncooked pasta, students will use the unit circle to discover the shape, amplitude, and period of the sine and cosine graphs.
The PowerPoint walks students through the activity and illustrates the shape of the graph on sine and cosine, amplitude and period and concludes with discussion questions.
Subjects:
Grades:
9th - 12th
Making Science Charts and Graphs
A simplified look at making charts and organizing data in science.
-Data Charts
-Circle Graphs
-Bar Graphs
-Line Graphs
-Key Vocabulary List
-Quiz/Assessment
-Activity - Practice
-Teacher answer key for quiz and activity
Thanks for taking the time to stop by my store!
Mrs. Degs
Teaching Science Well
Blog: http://teachingsciencewell.wordpress.com/
Facebook: https://www.facebook.com/TeachingScienceWell
TPT: http://www.teacherspayteachers.com/Store/Teaching-Science-Well-Science-Resources
Pi
Subjects:
Grades:
3rd - 10th
Real World Absolute Value Functions Activity
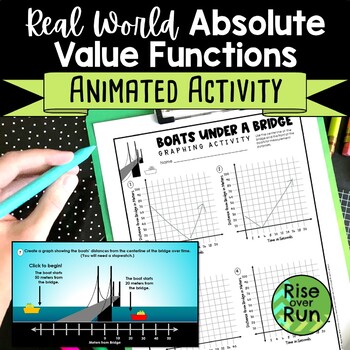
Challenge students to use absolute value graphs and equations for modeling real world situations! In the animated PowerPoint provided, students watch boats move across the screen and under a bridge. Using a stopwatch (or their phones), they time the movements. They create a graph showing each boat’s distance from the bridge. Then they determine each function and x-intercept (or when the boat passes under the bridge). 8 animations are provided. They begin simple but progress in difficulty. This
Subjects:
Grades:
9th - 12th
CCSS:
Also included in: Algebra 1 and 8th Grade Math Curriculum Bundle for Entire Year
Showing 1-24 of 2,186 results


