356 results
Statistics assessments $5-10
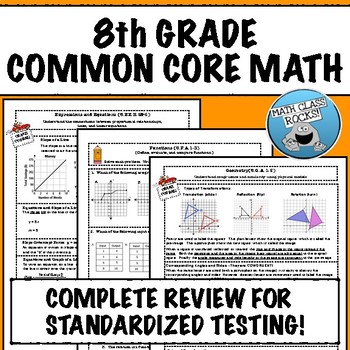
8TH GRADE MATH COMMON CORE REVIEW
If you need to prepare your students for a standardized test based on the Common Core, this “crash course” is exactly what you need! Organized by standard and easy to use, just print and let the reviewing begin! What's Included?This download consists of 10 “crash course” reviews with explanations and examples. Every "crash course" is followed by a practice assessment comprised of items aligned with standardized state tests. The Number SystemKnow that there are numbers that are not rational, a
Subjects:
Grades:
7th - 9th
Types:
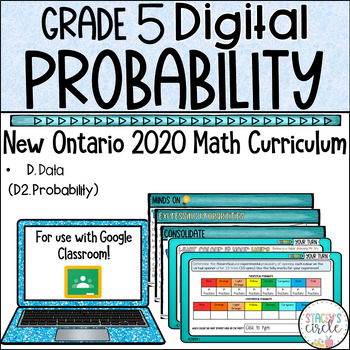
Grade 5 Probability 2020 Ontario Math Digital Googles Slides : D . Data
This resource includes a comprehensive Grade 5 Ontario Math Probability curriculum unit including lessons, activities, assessment and social emotional learning skills.This unit covers EVERY SPECIFIC Expectation from the 2020 Ontario D2. Probability (D. Data) strand. WHY BUY THIS PRODUCT OVER OTHERS?My vision for teaching math is always "Don't just tell the story, let the students become part of the story".Students will be walked through curriculum concepts step-by-step in easy-to-understand lang
Subjects:
Grades:
4th - 6th
Types:
Statistics Project
This is a survey project that is aligned to the 6th and 7th Grade Common Core (6.SP.1 to 6.SP.5 and 7.SP.1 to 7.SP.4). Students survey a random sample and then calculate the mean, median, range, and mode of the data. They also must create different data displays such as histograms and box and whisker plots. This project is an all encompassing activity that gets students thinking about statistics and loving math! They prove their understanding of the topics by asking questions they are interested
Grades:
6th - 7th
Types:
Analyzing Plots, Graphs, and Tables using Measures of Central Tendency
This product provides students the opportunity to analyze data presented in different ways. By making calculations and analyzing data, students make conjectures and justify them using mathematical reasoning and evidence!What is included?This product contains 8 student work pages. Each work page contains a set of data displayed graphically with accompanying questions. The data displays included are 2 dot plots, 2 bar graphs, 2 frequency tables, and 2 stem-and-leaf plots. Students are required
Subjects:
Grades:
5th - 11th
Types:
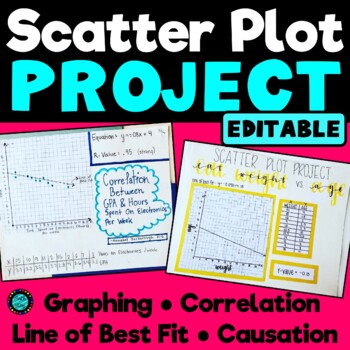
Scatter Plot Statistics Project Correlation Causation Trend Line EDITABLE
A great project to assess students' mastery of scatter plots and bivariant data, correlation coefficient, association, line of best fit, the equation of the line of best fit, and causation. Students are asked to research or collect their own data on the topic of their choice (for example: find the current age and yearly salaries of 10 famous actors, find the height and shoe sizes of 10 different students, or measure the arm span and height of 10 different people). They will display and include
Subjects:
Grades:
7th - 10th
Types:
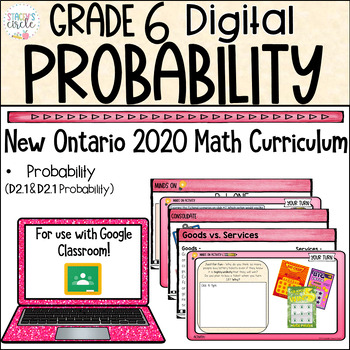
Grade 6 Ontario Math Probability Unit Digital Slides
Are you looking for an engaging and relatable way to teach your students concepts from the entire Grade 6 Ontario Math Probability strand? Your search ends here. WHY BUY THIS PRODUCT OVER OTHERS?My vision for teaching math is always "Don't just tell the story, let the students experience the story first hand. HOW?Students will be walked through curriculum concepts step-by-step in easy-to-understand language using identifiable and relatable problemsRather than mostly instructional slides, this pr
Subjects:
Grades:
5th - 7th
Types:
Also included in: Grade 6 Ontario Math Curriculum FULL YEAR Digital Slides Platinum Bundle
![Preview of Statistics Final Exam and Review [AP, College, and Honors]](https://ecdn.teacherspayteachers.com/thumbitem/Statisticis-FinalReviewStudy-Guide-Exam-1711356723/original-699492-1.jpg)
Statistics Final Exam and Review [AP, College, and Honors]
You can use this Statistics Final Exam in an AP Statistics, Honors Statistics, or a College Statistics course as an assessment, review or both. What's Included?Included are 6 different versions, each including 60 well chosen representative questions in both multiple choice format and also in free response format*. These reviews and tests work well in class or as a take- home. The tests are editable with Adobe Acrobat Pro. Each test should take about 2 - 3 hours and can be taken with a graphin
Subjects:
Grades:
10th - 12th, Higher Education
Types:
CCSS:
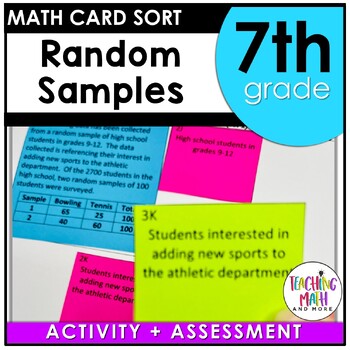
Random Samples & Populations Card Sort Activity Lesson
This lesson unit is intended to help you assess how well students are able to understand that statistics can be used to gain information about a population by examining a sample of the population; generalizations about a population from a sample are valid only if the sample is representative of that population. Understand that random sampling tends to produce representative samples and support valid inferences. Use data from a random sample to draw inferences about a population with an unknown c
Subjects:
Grades:
7th
Types:
Also included in: Math Card Sort Activity Grade 7 BUNDLE
Examining Effects of Outliers on Measures of Central Tendency
This 10-page document contains 3 real-life data sets. For each data set, students are guided through an exploration of how outliers in data affect mean, median, mode, and range. Each data set requires students to perform calculations and analyze data. Students will make conjectures and justify them in writing using mathematical reasoning and evidence.
At the end of the activity, students are asked several concluding questions that require them to analyze and evaluate their work. They focus
Subjects:
Grades:
5th - 9th
Types:
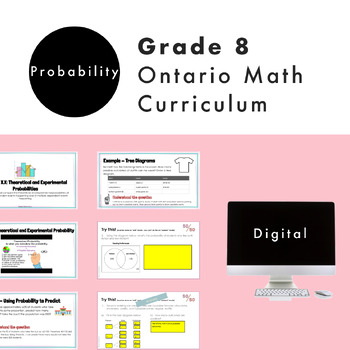
Grade 8 Ontario Math Probability Digital Google Slides + Form
Do you need a practical and engaging resource for the NEW Ontario Math Number strand? Are you planning for the NEW Grade 8 Ontario Math Curriculum? This editable Google Slide resource is what you need! This resource is for the Grade 8 DATA strand and covers specific expectations for “D2 Probability". In this resource, students will experience math through engaging real-life questions, storytelling through math, and interactive slides. What’s Included2 Google Slide presentations67 UNIQUE and ED
Subjects:
Grades:
7th - 9th
Types:
Also included in: Grade 8 NEW Ontario Math Curriculum Full Year Digital Slides Bundle
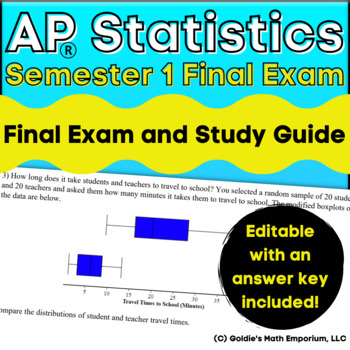
Goldie's AP® Statistics Semester 1 Final Exam and Study Guide
AP® Statistics Semester 1 Final Exam and Study GuideThis product contains original multiple choice and free response questions over one- and two-variable data, collecting data, probability, and random variables.Included in this product:Semester 1 Final20 multiple choice questions and 3 free response questions over Units 1-4 in the AP Statistics CEDSemester 1 Study Guide21 free response questions over Units 1-4Answer keys for each are included along with the editable Word document****************
Subjects:
Grades:
10th - 12th
Types:
Also included in: Goldie's FULL CURRICULUM for AP® Statistics
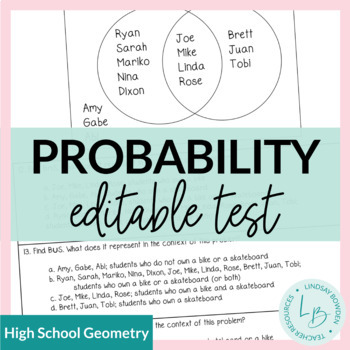
Probability Test with Study Guide
This resource includes a probability unit test and study guide for a compound and conditional probability unit.The editable versions are PowerPoints where you can edit text as needed. Topics covered:Set theory (sample space, union, intersection, complement, Venn diagrams)Outcomes and basic probability (coins, dice, tree diagrams, Fundamental Counting Principle)Compound probability (problems using addition and multiplication rules, frequency tables, independent/dependent events, mutually exclusiv
Subjects:
Grades:
9th - 11th
Types:
CCSS:
Also included in: Probability Unit Bundle
8th GRADE MATH: COMMON CORE REVIEW & PRACTICE TEST
If you need to prepare your students for a standardized test based on the Common Core, this “crash course” is exactly what you need!
When I realized that my students had to take the state test during the first week of April, I knew it would be impossible for me to cover all of the material to prepare them for the test! So, I created this review in the hope that it would, at the very least, familiarize them with concepts and help them to be successful! In addition, I created a complete practice
Subjects:
Grades:
7th - 9th
Types:
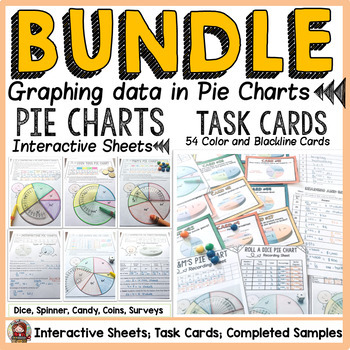
PIE CHARTS/PIE CIRCLE GRAPHS TASK CARDS AND {NO PREP} SHEETS BUNDLE
If you would like to teach a unit on pie charts using a combination of task cards and print-n- go activity sheets, then this activity pack fits the purpose. Please note that content in both worksheets and task cards is the same. You may have students work on the task cards at a center and then send the worksheets home for reinforcement or use them as an assessment tool to assess taught content or review concepts.***********************************************************************►► Details on
Subjects:
Grades:
3rd - 6th
Types:
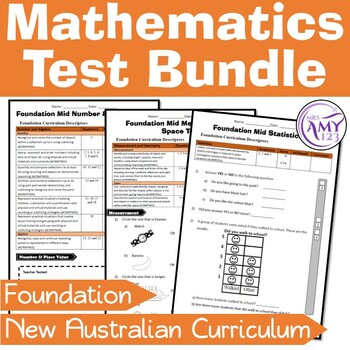
Foundation Mathematics Test Pack- Australian Curriculum
This is a bundle of tests that determine whether students have met the end of year requirements for a Foundation student in Number & Algebra, Measurement & Geometry and Statistics & Probability according to the Australian Mathematics Curriculum standards.A set of tests to be used during the middle of the year to assess students progress towards the outcomes has also been included.Includes a set for version 8.4 of the Australian Curriculum and version 9. WA teachers should use verison
Subjects:
Grades:
K
Types:
Statistics & Probability Common Core Unit {grade 8}
Statistics and Probability unit for grade 8 includes: interactive notebook pages, enter/exit tickets, task cards, activities, worksheets and assessments to teach the following 8th grade math standards:
8.SP.1 - Scatter plots
8.SP.2 - Trend lines
8.SP.3 - Interpreting linear models
8.SP.4 - Two-way tables and Relative-frequency tables
Use the interactive notebook pages as inspiration for how to organize your class's INB. Notes are included with each INB page to give tips and tricks for using th
Subjects:
Grades:
8th
Types:
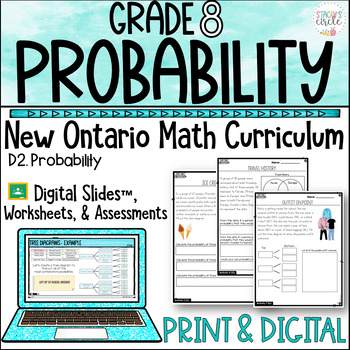
Grade 8 Ontario Math Probability Printable and Digital Unit
Are you an Ontario Math Teacher looking to excite and engage your math learners with a no-prep complete Grade 8 Probability Unit in digital AND printable formats? If you're tired of pulling resources from multiple different sources, then this comprehensive Ontario Curriculum-aligned resource by Stacey's Circle is the solution!NOTE: This resource covers the specific expectations -D2.1 and D2.2Your purchase comes in PRINT & DIGITAL Formats.WHY BUY THIS PRODUCT OVER OTHERS?My vision for teachin
Subjects:
Grades:
7th - 9th
Types:
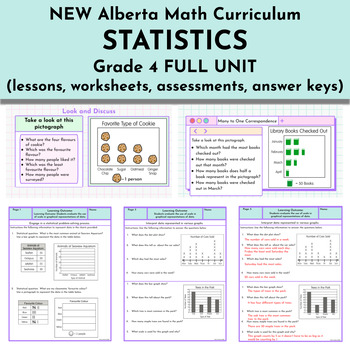
Statistics Unit - NEW Alberta Math Curriculum Grade 4
This Grade 4 Statistics resource is intended to meet the NEW 2023 Alberta Math curriculum expectations. Learning Outcome: Students evaluate the use of scale in graphical representations of data.Skills and Procedures:Engage in a statistical problem-solving process.Select an appropriate scale to represent data.Represent data in a graph using many-to-one correspondence.Describe the effect of scale on representation.Justify the choice of graph used to represent certain data.Compare different graphs
Subjects:
Grades:
4th
Types:
Also included in: FULL YEAR Alberta Math Curriculum - Grade 4
Statistics & Probability Project - CCSS 7.SP (Editable)
Hi Everyone!
In this project, students will be able to:
- Create a survey question.
- Poll 50 students.
- Organize data into tables and graphs.
- Find the mean, median, mode, and range of their data.
- Find the probability of each event occurring.
- Explain their survey process and results.
In the zip file that you downloaded, you will find three copies of the Statistics & Probability Project:
- Rough Draft (Paper Copy)
- Final Draft (Paper Copy)
- Google Doc Copy
The first two are the c
Subjects:
Grades:
7th
Types:
Probability Unit Activities and Assessments (Algebra 2 - Unit 12)
This file is a bundled set of content quizzes, mid-unit quizzes, reviews, four activities, and two unit tests. All keys are included in the unit bundle on PROBABILITY. The unit is designed to cover the material in-depth and to challenge your Algebra 2 Honors students.Additional Practice Assignments or Homework:5 Daily Quizzes, (two forms each day)☑ Permutations & Combinations☑ Theoretical & Experimental Probability☑ Independent & Dependent Events☑ Conditional Probability☑ Compound Ev
Subjects:
Grades:
8th - 11th, Higher Education
Types:
CCSS:
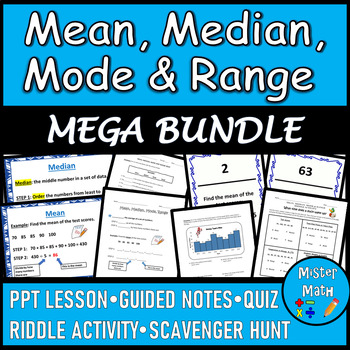
Mean, Median, Mode & Range MEGA BUNDLE
This Mean, Median, Mode & Range MEGA BUNDLE is just what you've been looking for to assist students in learning about calculating the mean, median, mode and range of data sets! Included in this bundle, you will find:Mean, Median, Mode & Range PowerPoint LessonMean, Median, Mode & Range Guided Notes (coincides with PowerPoint Lesson)Mean, Median, Mode & Range Riddle ActivityMean, Median, Mode & Range Scavenger HuntMean, Median, Mode & Range QuizYou'll SAVE MONEY when you p
Subjects:
Grades:
3rd - 6th
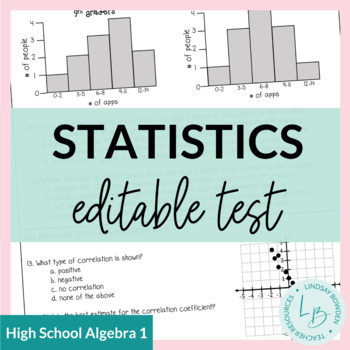
Statistics Test with Study Guide
This resource includes a statistics unit test and study guide for an Algebra 1 statistics unit.The editable versions are PowerPoints where you can edit text as needed.Topics covered:Histograms, Dot Plots, Box and Whisker PlotsRange, Interquartile RangeMean Absolute DeviationTwo-Way Frequency TablesScatter Plots and CorrelationLine of Best Fit There are 20 multiple choice questions and 10 free response questions. Test and answer documents are divided so that if you only wanted to give the multipl
Subjects:
Grades:
8th - 10th
Types:
CCSS:
Also included in: Statistics Unit Bundle
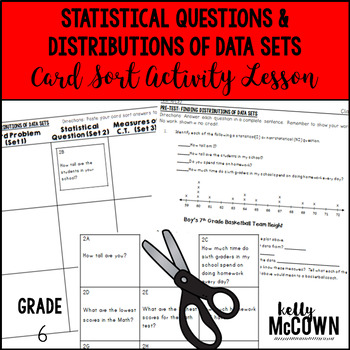
Statistical Questions & Distributions of Data Sets Card Sort Activity Lesson
This lesson unit is intended to help you assess how well students are able to recognize a statistical question as one that anticipates variability in the data related to the question and accounts for it in the answers. Understand that a set of data collected to answer a statistical question has a distribution which can be described by its center, spread, and overall shape.
Included in this lesson are:
-One formative assessment (pre-test) tasks
-Card sort activity with concept development o
Subjects:
Grades:
6th
Types:
Also included in: Math Card Sort Activity Grade 6 BUNDLE
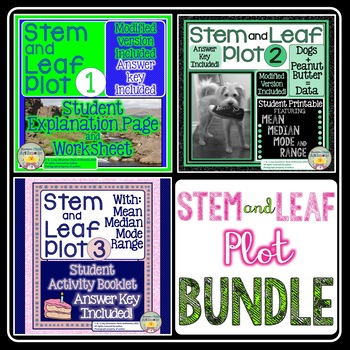
Stem and Leaf Plot Bundle
With three products in one, this bundle will give your kiddos lots of practice with stem and leaf plot, as well as mean, median, mode, and range! All answer keys have ALL WORK SHOWN!!!Included:Resource 1 (7 pgs): cover teacher notesstudent notesstudent printablemodified version!!answer keycredits Resource 2 (5 pgs): cover student printable incorporating stem and leaf plot with mean/median/mode/rangemodified version!!answer keycreditsResource 3 (10 pgs): coveractivity booklet...A great challenge
Subjects:
Grades:
5th - 8th
Types:
Showing 1-24 of 356 results


