501 results
6th grade graphing graphic organizers
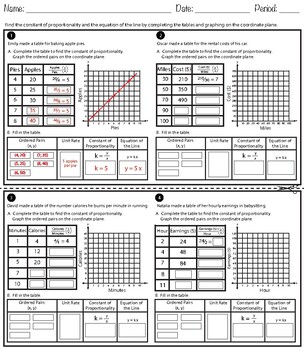
Identifying Constant of Proportionality Using Tables, Graphs and Equations
These worksheets can be served as a graphic organizer or a handout to practice in identifying constant of proportionality (unit rate) using tables, graphs, equations and verbal descriptions of proportional relationships. Students will make tables of equivalent ratios, find missing values in the tables, and plot the pairs of values on the coordinate plane to identify the constant of proportionality. Students will also select statements which is true or false in interpreting a point (x, y) on t
Grades:
6th - 8th
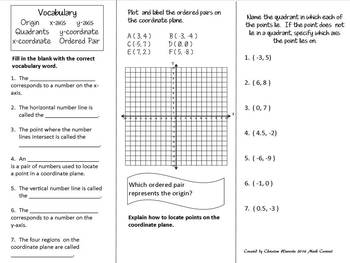
Coordinate Plane (4 Quadrants) Print n' Fold (Foldable) Interactive Notebook
I love this Print n' Fold!! What a great way to start your lesson or sum it up! It is foldable and can be glued right into any notebook. The pictures show it folded and opened. Flaps fold on lines and back center is glued down. Answer key included.
In this Print n' Fold students are asked to:
Label the four quadrants.
Plot and label ordered pairs in all four quadrants.
Explain how to locate points on the coordinate plane.
Name the quadrant or axis a point lies.
List the ordered pair of numbers
Subjects:
Grades:
5th - 8th
CCSS:
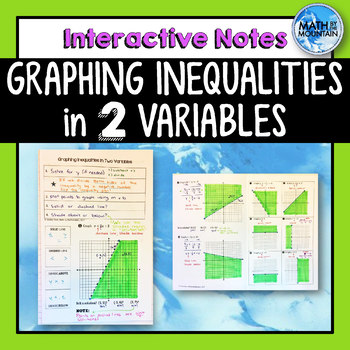
Graphing Linear Inequalities in 2 Variables Interactive Notebook Notes
These notes are perfect for an interactive notebook (INB) and are built to reinforce prior concepts. Help your students see the process graphing inequalities in two variables on the coordinate plane. Explore the special cases of vertical and horizontal inequalities! In some examples, students must solve for y prior to graphing, which is a fantastic review of (1) rerwriting equations, (2) remembering the flip the sign, and (3) identifying slope and y-intercept! The front page of these notes are
Subjects:
Grades:
6th - 10th
CCSS:
Also included in: Unit 7 - Systems of Equations & Inequalities - Interactive Notebook Kit
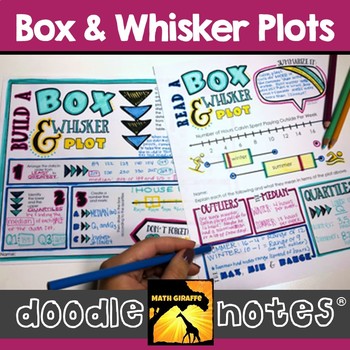
Box and Whisker Plots Doodle Notes
reading and creating box & whisker plots: visual interactive "doodle note" setWhen students color or doodle in math class, it activates both hemispheres of the brain at the same time. There are proven benefits of this cross-lateral brain activity:- new learning- relaxation (less math anxiety)- visual connections- better memory & retention of the content!Students fill in the sheets, answer the questions, and color, doodle or embellish. Then, they can use it as a study guide later on. G
Subjects:
Grades:
6th - 8th
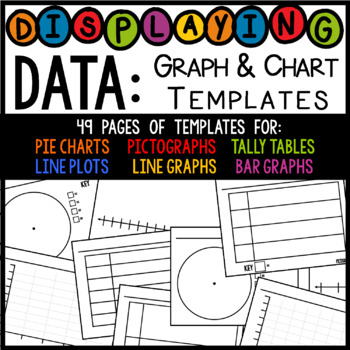
Displaying Data: Graph, Table, and Chart Templates (PDF & PNG)
These forms can be used for almost anything having to do with displaying data in a visual form. I've included the most popular graphs and tables used in elementary school. All templates below come in a PDF and a PNG. You can use the PNG to edit the graphs and charts in PowerPoint by using text boxes. Pie ChartsThere are 7 options for pie charts (2 to 9 categories). Line PlotsThere are 4 options for line plots: 5 lines, 7 lines, 13 lines, 18 lines. PictographsThere are 5 options for pictograph
Grades:
1st - 8th
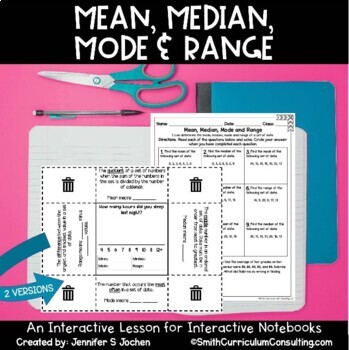
Mean, Median, Mode and Range Foldable Interactive Notebook Lesson with Practice
Ready to review the basics of Mean, Median, Mode and Range? This flippable has all that you need for your students to have a resource for the definition, a keyword to help them remember, as well as a graph to compile data from the class and determine the Mean, Median, Mode, and Range for your class data!Includes:Teacher Directions with a full-color photoMean, Median, Mode, and Range Foldable (2 versions)Mean, Median, Mode, and Range Practice SheetMean, Median, Mode, and Range Practice Sheet Answ
Subjects:
Grades:
5th - 7th
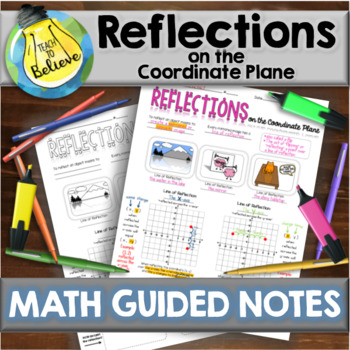
Reflections on the Coordinate Plane - Guided Notes
Reflections on the Coordinate Plane - Guided Notes These notes explain to your students how to reflect a point across an axis. What is Covered:-Explanation of "Line of Reflection"-Explanation of Reflecting Across an Axis-ExamplesWhat's Included:-Blank Student Copy-Typed Colorful Key-Completed Student SampleHow to Use This Product:After students have completed these guided notes, it is best for them to keep them in sheet protectors in a math folder. You can download a FREE blank table of contents
Grades:
6th
CCSS:
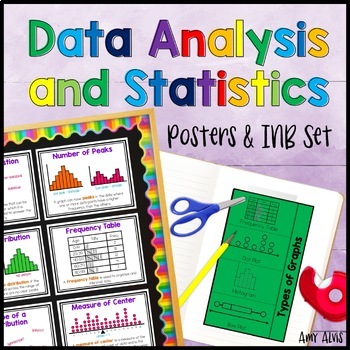
Data Analysis and Statistics Posters and Interactive Notebook INB Set
This poster (anchor chart) and interactive notebook (INB) set covers statistical questions, numerical data, categorical data, frequency table, dot plot, histogram, box and whisker plot, box plot, parts of a box and whisker plot, parts or a box plot, measure of center, spread, shape of distribution, symmetry, number of peaks, skewness, uniform distribution, outlier and gaps. The INB pages cover Types of Graphs, Statistical Questions and Patterns in Data.It includes 3 different interactive foldabl
Subjects:
Grades:
6th - 8th
Also included in: 6th Grade Posters and Interactive Notebook INB BUNDLE Anchor Chart
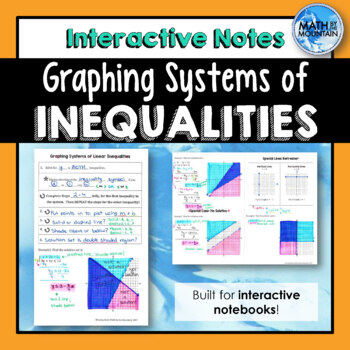
Solving Systems of Inequalities by Graphing Interactive Notebook Notes
This set of solving systems of inequalities by graphing problems comes complete with 4 examples, plus a refresher on how to graph vertical and horizontal lines! These notes are perfect for an interactive notebook (INB) and are built to reinforce prior concepts. Help your students see the process behind solving a system of linear inequalities. Explore the special case of having no solution as well as graphing with horizontal and vertical lines.All examples have been thoughtfully chosen to generat
Subjects:
Grades:
6th - 12th
CCSS:
Also included in: Unit 7 - Systems of Equations & Inequalities - Interactive Notebook Kit
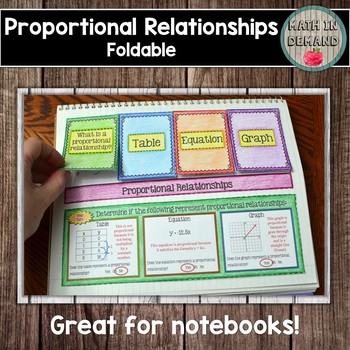
Proportional Relationships Foldable
Included is a proportional relationship foldable. This foldable is a great way for students to study how a table, graph, and equation have a proportional relationship. Students will need scissors and glue to construct the foldable.Answers are included. There are two ways that you can have students construct the foldable. 1) You can have students construct the foldable with the answers already given OR 2) You can have students fill in the answers.CLICK HERE to see my math foldables bundle!
Grades:
6th - 9th
Also included in: Math Foldables Bundle (Includes All Math Wheel Foldables)
Blank Bar Graph/Double Bar Graph Template
This is a bar graph template that can be used by teachers to teach students how to understand bar graphs and create their own bar graphs. Teachers can use this template teach students about parts of a bar graph and how to interpret data in bar graphs.
Grades:
1st - 12th
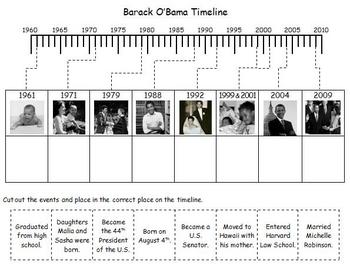
President's Day - Barack Obama Photo Timeline
Students will learn about the important events in Barack Obama's life as they complete this photo timeline. Two versions are included, one for upper elementary and one for lower elementary.
Subjects:
Grades:
1st - 6th
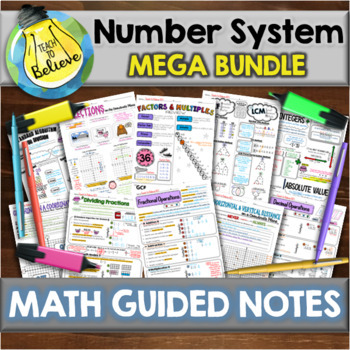
Number System ALL 6th GRADE STANDARDS Bundle Guided Notes/Interactive Notebook
Ratio and Proportions ALL 6TH GRADE STANDARDS Guided Notes/ Interactive NotebookThis bundle completely covers all 6th grade Ratio and Proportions Standards!What's Included:- Dividing Fractions & Fractional Operations Review-DOUBLE NOTE PACK- Standard Algorithm for Division- Decimal Operations Guided Notes- Factors and Multiples Review Guided Notes- GCF & LCM Guided Notes-Integers and Absolute Value Guided Notes-Graphing on a Coordinate Plane Guided Notes-Reflections on the Coordinate Pla
Grades:
5th - 8th
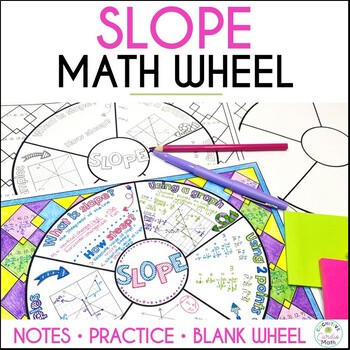
Finding Slope Guided Notes Doodle Math Wheel for Interactive Notebooks
Introduce or review finding slope with this colorful, engaging math wheel! Students take notes, use color to help with memory, and complete practice problems found around the wheel.Students can keep this graphic organizer in their notebooks as a resource/study tool.This easy-to-use finding slope resource includes:Slope math wheel, 2 versions:One with blank space to fill in the notes One with all the notes filled in (but not the work for the example problems), in case you have students who are ab
Grades:
6th - 8th
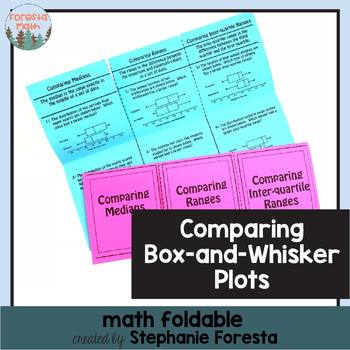
Comparing Box-and-Whisker Plots Math Foldables
A fun foldable to teach or review comparing medians, ranges, and inter-quartile ranges of two box-and-whisker plots.
Subjects:
Grades:
5th - 10th
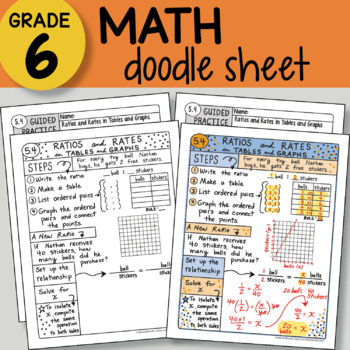
Doodle Sheet - Ratios and Rates in Tables and Graphs - Easy to Use Notes w/PPT
INCLUDED in this download:Math Doodle SheetGuided Practice Sheet PowerPoint – to show students the KEY– two versions of both sheets included: INB and large 8.5 x 11 sizeTEKS and CC Aligned – plan for the FULL year includedThis download is part of a larger bundle of 68 Doodle Sheets found here: 6th Grade Math ALL the DOODLE Sheets ~ So Fun and Engaging!These 6th grade math doodle sheets are a great way to help the students learn math concepts! Students are engaged as they take creative notes and
Subjects:
Grades:
5th - 7th
Blank Line Graph Template
Check out this simple and student friendly line graph template that teachers can easily use to teach students the parts of a line graph and use as they build their foundational skills. Apply best practice skills and use every minute of instruction by not wasting time by having students draw out their sloppy lines and simply glue this template in their math notebooks or take home with them to work on HW :) Also includes a side by side page for extra practice space!
Hashtag Teached Resources by #
Subjects:
Grades:
2nd - 9th
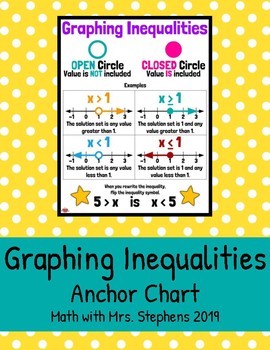
Graphing Inequalities Anchor Chart
This anchor chart includes information on how to graph inequalities on a number line. A black-and-white version and a colored version are included. This can be printed one per page for individual student binders/notebooks or enlarged to be printed as a poster or anchor chart.
Grades:
6th - 8th
Also included in: 6th Grade Math (& More) Anchor Charts *BUNDLE*
Math Graphic Organizers - The Coordinate Plane
Teach, scaffold, and review middle school math topics with easy-to-use graphic organizers for the Coordinate Plane. All the key vocabulary and skills are covered. Everything students need to understand and use Cartesian grids is on one page. During direct instruction, they can follow along on their own copy. When working independently, students can refer back to the math graphic organizer for review and remediation. Answer keys included!SUGGESTED USESLesson scaffoldsHomeworkNo-prep Interactive B
Grades:
5th - 9th
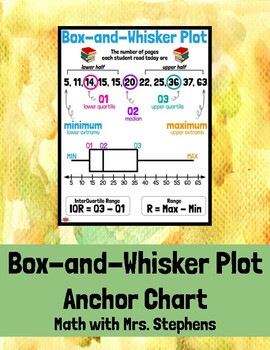
Box-and-Whisker Plot Anchor Chart
This anchor chart displays a data set with its corresponding box-and-whisker plot. It includes vocabulary of the "5 Number Summary", such as minimum, lower quartile, median, upper quartile, and maximum. The range and IQR are also represented. This can be printed one per page for individual student binders/notebooks or enlarged to be printed as a poster or anchor chart.
Subjects:
Grades:
6th - 8th
CCSS:
Also included in: 6th Grade Math (& More) Anchor Charts *BUNDLE*
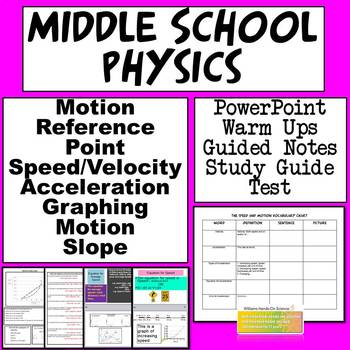
NGSS Force and Motion PowerPoint Guided Notes Study Guide & Test Math Test Prep
This product is perfect for middle school physics motion! You get a 38 slide PowerPoint with guided notes that accompany it that’s perfect for all learners, especially SPED and ELL students. Within the PowerPoint are questions so you can check for understanding, pictures for context and a YouTube link. You also get a study guide with a key and an editable test with a key that your students will ace if you use all of the above, along with hands on labs you already do. Or you can take a look at my
Subjects:
Grades:
6th - 9th
NGSS:
MS-PS2-2
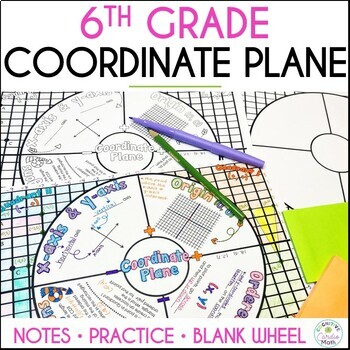
Coordinate Plane Doodle Math Wheel, 6th Grade Guided Notes and Practice
Introduce or review coordinate plane concepts with this unique, engaging note-taking format!Students take notes, use color to help with memory, and complete practice problems found around the wheel.Students can keep this graphic organizer in their notebooks as a resource/study tool.For a wheel that focuses more on quadrant one, check out the Coordinate Plane Math Wheel for grade 5.The sections of the coordinate plane wheel for 6th grade include:1) x-axis and y-axis2) Origin 3) Ordered Pair 4) Di
Grades:
6th
CCSS:
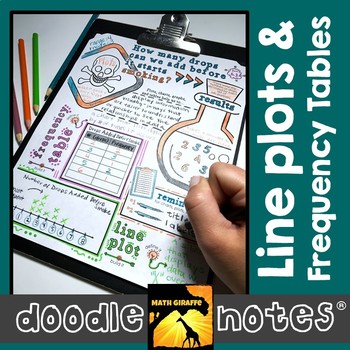
Line Plots & Frequency Tables Doodle Notes
working with charts and plots in math class: visual interactive "doodle note" When students color or doodle in math class, it activates both hemispheres of the brain at the same time. There are proven benefits of this cross-lateral brain activity:- new learning- relaxation (less math anxiety)- visual connections- better memory & retention of the content!Students fill in the sheets, answer the questions, and color, doodle or embellish. Then, they can use it as a study guide later on. Graph
Grades:
5th - 7th
CCSS:
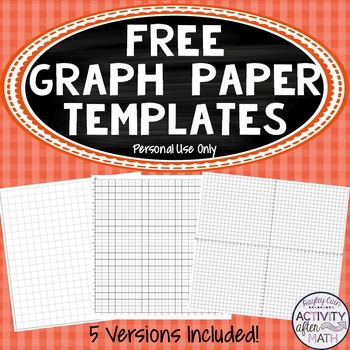
FREE Cartesian Coordinate Plane Graph Paper Templates (Personal use only)
This is a set of 5 different Cartesian Coordinate Plane Graph Paper templates. This is great for helping teach graphing ordered pairs, teaching Algebra concepts, drawing pictures, graphing equations, creating line graphs from word problems, etc.Included in this product:5 separate Coordinate Planes:-1st Quadrant to 20 -1st Quadrant to 20 with Fractional Gridlines-1st Quadrant to 20 No labels-All 4 Quadrants to 20 -All 4 Quadrants to 20 No LabelsPlease note that this product is for PERSONAL use ON
Subjects:
Grades:
5th - 9th
Showing 1-24 of 501 results


