14 results
Not grade specific statistics graphic organizers
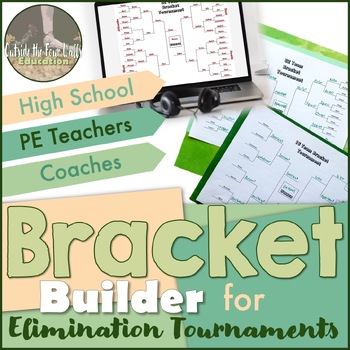
Bracket Builder for Tournaments
Looking to bring some friendly competition in your curriculum? Use these editable brackets to bring a tournament into your classroom! These editable brackets will self-populate based on the order you rank your teams. This is a great opportunity to teach about statistics and probability in real-life situations. In this spreadsheet, you will get:Linked spreadsheets so your data can be filled in on one spreadsheet and auto-populate on the bracket of choice.2 different 16 team brackets – one standar
Grades:
Not Grade Specific
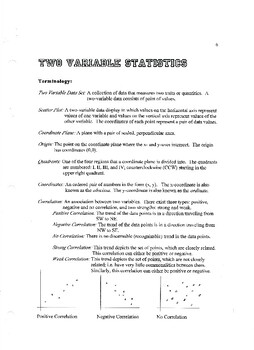
Statistics - Two Variable Stats
Introduction to two-variable statistics. Included: terminology, graphical correlation, and TI-84 steps and analysis.
Subjects:
Grades:
Not Grade Specific
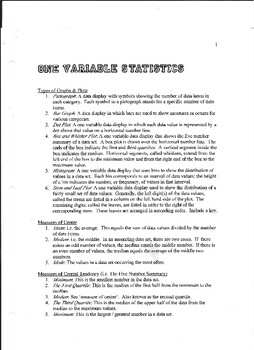
Statistics - One Variable Stats
Includes an introduction into the types of graphs, measures of center, measures of central tendency, and standard deviation. TI-84 calculator steps are included in addition to selected formulas.
Subjects:
Grades:
Not Grade Specific
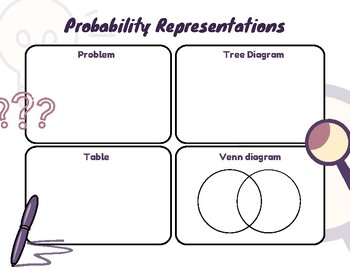
Visual Representations of Probability Graphic Organizer
Graphic Organizer for teaching visual representations of probability. Tree DiagramArea Model (table)Venn DiagramExample of completed sheet included.
Subjects:
Grades:
Not Grade Specific
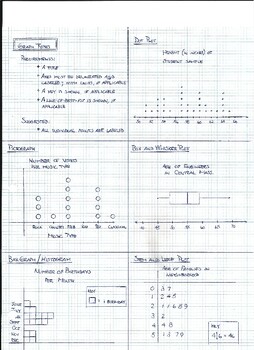
Statistical One-Variable Graphs
Different one-variable plots are illustrated, including their respective requirements.
Subjects:
Grades:
Not Grade Specific
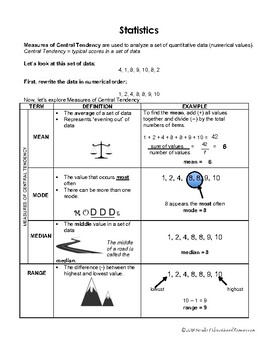
Measures of Central Tendency Reference Sheet
Do your students often confuse mean, median, and mode? This handy reference sheet with visual cues can help students remember the difference and how to calculate these important measures of central tendency.
Subjects:
Grades:
Not Grade Specific
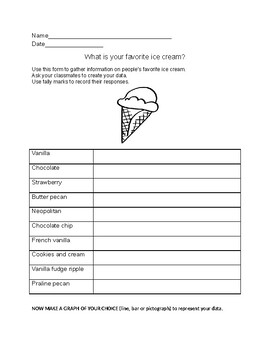
Ice Cream Data Collection
Collect real time data!!!! Then make a graph (line/bar graph template included, but .you can take it further!)Build those early statisticians! And let them eat....Ice cream!
Subjects:
Grades:
Not Grade Specific
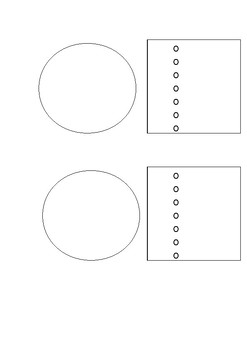
Template - Pie Graph
Print off to save you time creating it yourself
Subjects:
Grades:
Not Grade Specific
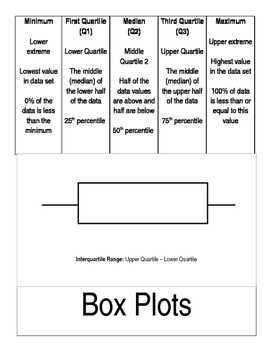
Box Plot Foldable
Foldable to teach the basics of a Box and Whisker Plot
Subjects:
Grades:
Not Grade Specific
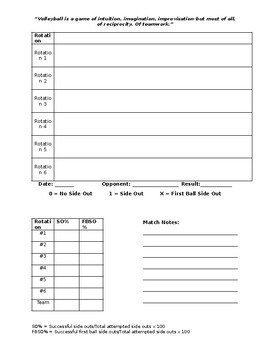
Volleyball Side Out Tracking Stat Sheet
Track your Side Out Percentage and First Ball Side Out Percentage with this detailed yet easy to use template. Includes rotation by rotation and whole team analysis.
Subjects:
Grades:
Not Grade Specific
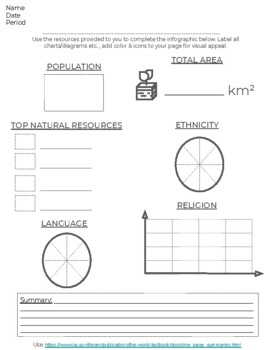
Country Infographic Worksheet
Print & Create a simple and informative infographic, with a summary for a country of your choosing based on the latest information found at the CIAworldfactbook one-page summary page, Junior Scholastic Almanac, or other sources. Great for introducing a new area of study. The second page of the PDF includes a dotted frame to assist your learners in cutting out to place in their interactive notebook!- Pro Tip: Use these sheets for comparing two countries or time periods in the same area to sh
Grades:
Not Grade Specific
CCSS:

TED Talk Handout - 100 Solutions to Reverse Global Warming
Handout to go with TED Talk - 100 Solutions to Reverse Global Warming by Chad Frischmann.I used it in my Statistics classroom as an introduction to a unit on climate change, but it would be great for an environmental studies class or ecology class as well.
Subjects:
Grades:
Not Grade Specific
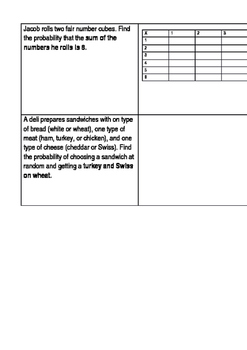
Theoretical Probability of Compound Events
Foldable that breaks down the 3 ways to do Compound Probability of Theoretical Events: Table, Tree, and List
Subjects:
Grades:
Not Grade Specific
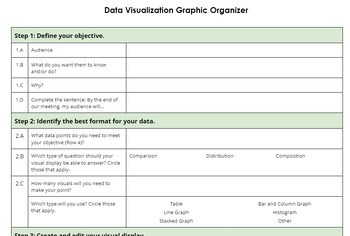
Data Visualization Graphic Organizer
Use these simple steps to help you create the best visualizations of your student’s data for your next coaching or grade team meeting!Or use this organizer to help you teach your middle or high school students storytelling techniques through graphs and charts!____________________________________________________________________________Follow Simplicity Education to receive updates on new products.Let’s connect:Join our Facebook group!Instagram | Pinterest | LinkedIn | Website
Subjects:
Grades:
Not Grade Specific
Showing 1-14 of 14 results


