103 results
8th grade statistics independent work packets
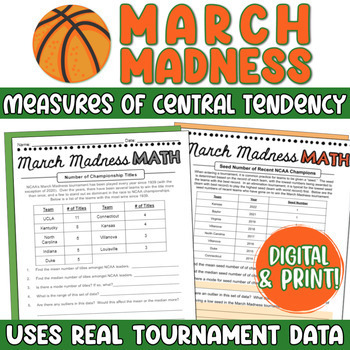
March Madness Math Mean, Median, Mode - Measures of Central Tendency Activity
This March Madness math activity asks students to determine mean, median, mode, and range for a variety of actual statistics from previous NCAA March Madness basketball tournaments. Perfect to excite any sports enthusiasts! It includes both print and digital formats, perfect for Google Classroom.Each page slide within the activity is dedicated to a different statistic (for example, years since previous championships amongst winners, regular season wins amongst Elite 8 teams, Seeds of Champions
Subjects:
Grades:
6th - 8th
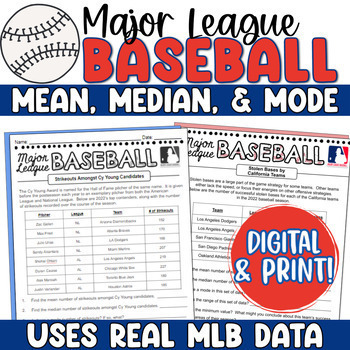
Baseball Math Mean, Median, Mode - MLB Baseball Measures of Central Tendency
This real-world baseball math statistics project asks students to determine mean, median, mode, and range for a variety of actual statistics from the 2023 Major League Baseball season. Perfect to excite any sports enthusiasts! It includes both a traditional print option and a digital version, made for Google for any 1:1 classrooms!Each slide within the activity is dedicated to a different statistic (for example, strikeouts amongst Cy Young candidates, or homeruns amongst MVP candidates). Stud
Subjects:
Grades:
6th - 9th
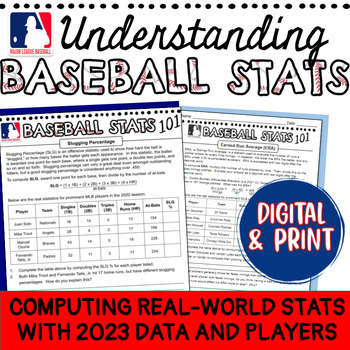
Understanding Baseball Stats MLB Math Sports Statistics Activity Digital & Print
This math baseball statistics activity is perfect for engaging your sports enthusiasts! It includes a Google Slides activity in which students explore and compute different baseball statistics using real numbers from the 2023 season, as well as the traditional print version. Students will enjoy seeing players they know and the real-life stats, and the higher order thinking questions will have them making connections in no time!This activity is great for enrichment, during baseball season, or fo
Subjects:
Grades:
7th - 10th
Types:
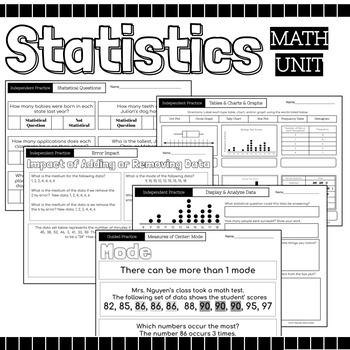
Statistics Math Packet {Data, Charts, Graphs, Mean, Median, Mode, Range, Spread}
52 Page Statics Unit Includes: Guided Instruction & Independent Practice Pages Usage Suggestions and IdeasThis resource can be utilized in numerous ways, here are some ideas:use for guided practiceassign as partner workassign as independent practicecan be used for morning workuse for reteaching in small group settinguse as review prior to assessmentuse as review in continuing to strengthen skillassign for homeworkuse as independent work during math centersTopicsRecognize Statistical Question
Subjects:
Grades:
4th - 12th
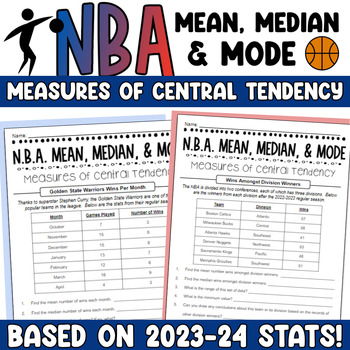
NBA Mean Median and Mode - Basketball Math Measures of Central Tendency
This NBA Measures of Central Tendency is perfect for your sports fans and just in time for basketball season or NBA Finals! Students find mean, median, mode, and range of real basketball stats from the 2023-2024 season. Statistics include number of wins, number of 3-point shots, number of blocks, points scored, and more!This resource can be used in a variety of ways, including whole-group instruction, small-groups, or independent work. It could also be broken into smaller parts and used for b
Subjects:
Grades:
6th - 8th
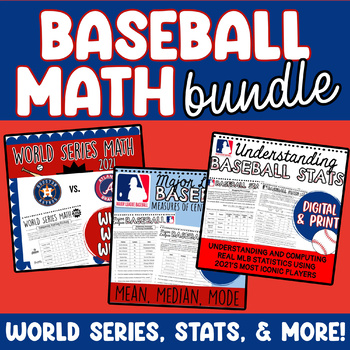
Baseball Math Activities Bundle for Real-World Statistics and World Series
This baseball math bundle includes three real world baseball stats products that are perfect for engaging your sports lovers! Students compute baseball stats, compare world series teams, and explore measures of central tendency using real-world stats!In World Series Math, students must determine which team is more likely to win comparing their players and statistics from the past season. Understanding Baseball Stats explains to students the meaning of common baseball statistics and how to comp
Subjects:
Grades:
6th - 9th
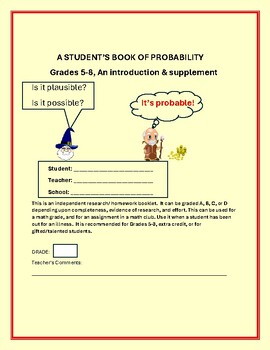
PROBABILITY: A STUDENT'S ACTIVITY/KNOWLEDGE BOOKLET GRADES 5-8, MG, & MATH CLUB
This is an independent activity booklet on probability. It is designed to enhance the learning of this mathematical theory. It has real life applications, a quiz, quotes, mystery quiz, biographies, and a writing prompt, etc. The intent is to show students how math is an integral part of life, and its functions. Answer keys are included. There is an art-design component for 2 activities, as well. This is a beginner-introduction/ supplement to this topic. Excelsior! Thank you ever so much for
Subjects:
Grades:
5th - 8th, Adult Education, Staff
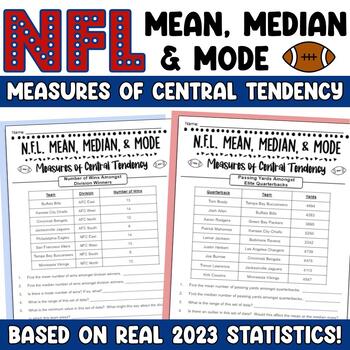
NFL Football Mean Median and Mode Real-World Sports Statistics Central Tendency
This Football Measures of Central Tendency is perfect for your sports fans and just in time for NFL playoffs and Super Bowl season! Students find mean, median, mode, and range of real football stats from the 2023 season. Statistics include number of wins, rushing yards, passing yards, field goal kicks, and number of touchdowns on the season. Higher order thinking questions are included for each topic.This resource can be used in a variety of ways, including whole-group instruction, small-grou
Subjects:
Grades:
6th - 8th
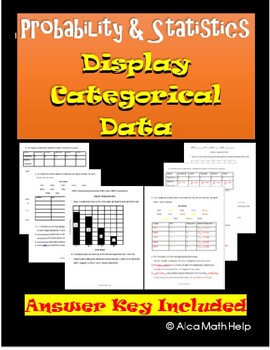
Categorical Data Display Pie Chart & Bar Chart: Worksheet, CW, HW CP & AP Stats
If you are looking for an easy to follow for students. You are at the right place. This is a quick and easy to follow activity sheet that brings across the concept clear and precise. Teachers in my department love this activity sheet. This is useful of CP Probability and Statistics, AP Statistics and Algebra 1 statistics unit. Categorical data and Display Variables ObjectivesAt the end of the lesson students should be able to:1. Correctly define categorical and quantitative data with examples2.
Subjects:
Grades:
8th - 12th, Higher Education, Adult Education, Staff
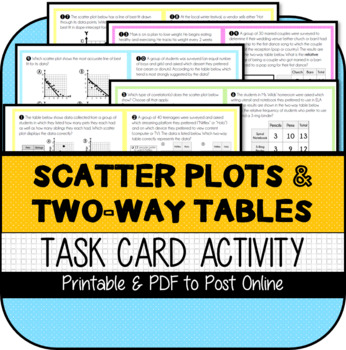
Scatter Plots & Two-Way Tables TASK CARDS
This resource contains the following items:1) 20 Printable Task Cards 2) Printable Student Answer Sheet3) Answer Key4) Optional version of Task Card file without answer key to POST ONLINE for students to reference at home or in a computer lab.This resource was developed to meet the requirements of the 8th Grade Statistics & Probability Standards below:CCSS.MATH.CONTENT.8.SP.A.1 Construct and interpret scatter plots for bivariate measurement data to investigate patterns of association betwee
Subjects:
Grades:
7th - 9th
Also included in: Scatter Plots & Two-Way Tables UNIT BUNDLE
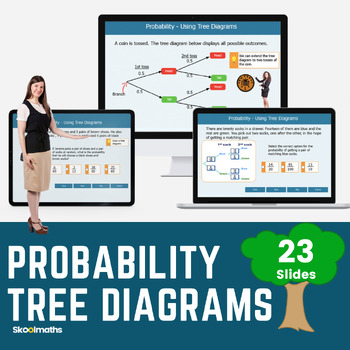
Probability Tree Diagrams Interactive Digital Resources CCSS.7.SP.C.5
Probability Tree Diagrams Interactive Lesson and Activities CCSS.7.SP.C.5Engage your middle school math class with this amazing interactive lesson plan which is focused on teaching probability tree diagrams, aligned with the Common Core State Standard 7.SPC.5. It includes self-marking activities and instructions designed to help middle school students understand and apply the concept of probability through tree diagrams. The interactive elements involve hands-on activities, digital simulations,
Subjects:
Grades:
7th - 8th
Also included in: High School Statistics and Probability Bundle
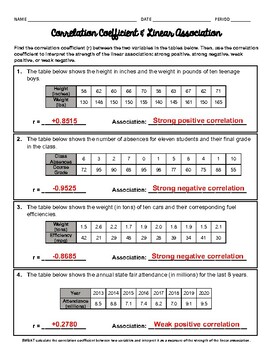
Correlation Coefficient and Linear Association Worksheet
8 question worksheet on using technology to find the correlation coefficient, and use it to determine the strength of a linear association (strong positive, strong negative, weak positive, or weak negative). #1 - 8 given a table in context of real-world problems, use technology to find the correlation coefficient (r) between the two variables. Then use r to determine the strength of the linear association. Answer key included.VISIT US AT WWW.ALMIGHTYALGEBRA.COM FOR MORE RESOURCES AND BUNDLED DIS
Subjects:
Grades:
8th - 12th
CCSS:
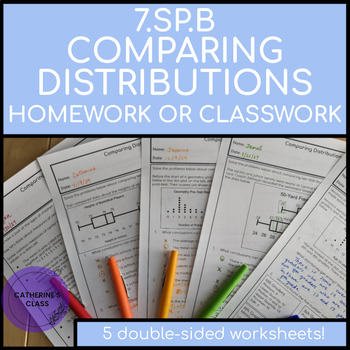
7.SP.B.3 & 7.SP.B.4 Comparing Distributions Classwork or Homework
5 double-sided worksheets covering 7.SP.B.3 & 7.SP.B.4 of the CCSS grade 7 statistics & probability domain including: comparing distributions displayed in dot plots and box-and-whisker plots; finding means, medians, and modes; finding 5-number summaries; finding IQRs and MADs; comparing IQRs to differences in medians; comparing MADs to differences in means; analyzing & correcting common misconceptions; and building confidence and fluency through extra practice. An answer key is inclu
Subjects:
Grades:
6th - 8th
Also included in: Entire Year of 7th Grade Math Worksheets MEGA BUNDLE
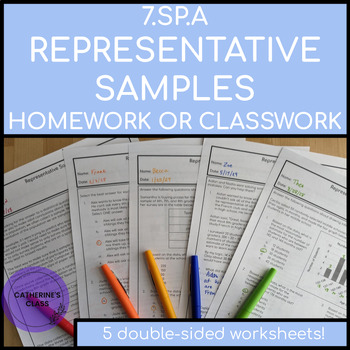
7.SP.A.1 & 7.SP.A.2 Representative Samples Classwork or Homework
5 double-sided worksheets covering 7.SP.A.1 & 7.SP.A.2 of the CCSS grade 7 statistics & probability domain including: determining whether or not a sample is representative of an entire population; making estimated inferences about a population based on the results of random sampling; analyzing & correcting common misconceptions; and building confidence and fluency through extra practice. An answer key is included for each worksheet.The worksheets are intended to be assigned as homewo
Subjects:
Grades:
6th - 8th
Also included in: Entire Year of 7th Grade Math Worksheets MEGA BUNDLE
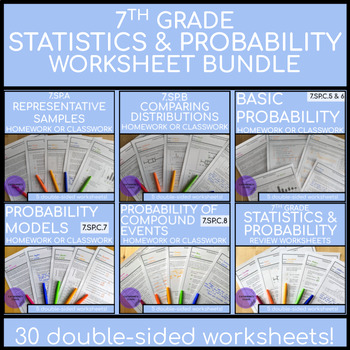
7th Grade Math Statistics & Probability Worksheet BUNDLE
A bundle including 30 double-sided worksheets with answer keys for every standard of grade 7 Statistics & Probability CCSS.The bundle also includes scaffolded versions of 3 of the Comparing Distributions (7.SP.B) resource.The worksheets are intended to be assigned as homework or as classwork for independent practice or group work. They are also great resources to use for sub plans. The worksheets are meant to be given after a skill has been introduced in class.Many Different Uses:HomeworkCla
Subjects:
Grades:
6th - 8th
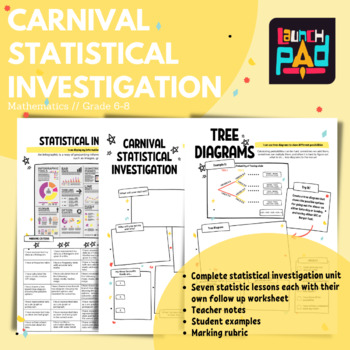
Carnival Statistical Investigation // Full Unit
You have been asked to run a stall at the Famous City Carnival! It is up to you what you sell, however, you want to make the most profit possible. It is important that you gain an understanding of what people like so that you make sales. You will need to complete a statistical investigation to create the stall as well as show your understanding and application of statistics. Students will learn and then apply statistical knowledge in each lesson of this unit and at the end create an infographic
Subjects:
Grades:
4th - 8th
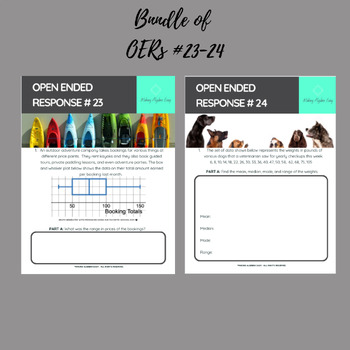
Algebra 1 Keystone Prep: OERs 23-24 Bundle on Data Analysis
This includes OERs #23 & 24. Each include open-ended questions that require students to show and explain their reasoning and to apply the concepts of data analysis involving a box and whisker plot and mean, median, mode, and range. These are appropriate for an Algebra 1 unit on Data Analysis. They are aligned the the Pennsylvania Keystone Exam but are also appropriate for other states for teachers who would like students to apply and explain.
Subjects:
Grades:
8th - 9th
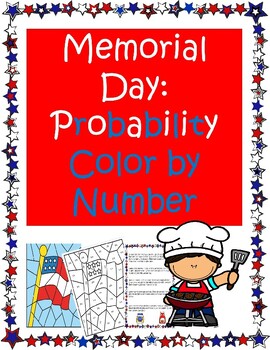
Memorial Day Probability Color by Number
In this activity, students are asked to find the probability that people at a cookout get the type of burger they want, then they are asked to find their answer on a color by number sheet. The colored picture is a flag -- great for Memorial Day and for math review in general.Product can be given for homework, independent practice or enrichment. Great for GED learners, Special Education students, and those needing an end-of-the-year review of probability.Fun exercise!No prep exercise. Answer K
Subjects:
Grades:
7th - 8th, Adult Education

Science Fair Weekly Assignment Packet
Do you struggle to help your students pace themselves through science fair projects? This packet helps to break the process down into manageable steps for students, and allows you weekly touch points with students to ensure their success. There is an overview of each assignment, and then space for the student to respond. I provide this packet to my students both on paper and via our LMS so they can always access what they need to do each week. This packet walks students through the independe
Subjects:
Grades:
5th - 8th
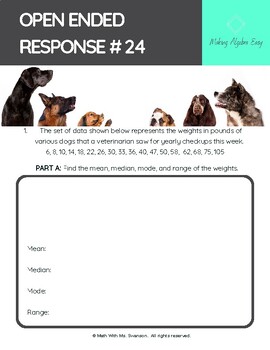
Algebra 1 Keystone Prep - OER 24 on Mean, Median, Mode, and Range
This is an open-ended response style question with multiple parts. This is appropriate for Algebra 1. Students need to first find the mean, median, mode, and range of a data set. They they need to interpret what will happen with the addition of a new data point.Pages 1 & 2 are the student version of the question with a pretty layout.Pages 3 & 4 are the teacher version / detailed annotated answer key.I used the open-ended questions in my Pennsylvania Algebra 1 classroom weekly in order t
Subjects:
Grades:
8th - 9th
Also included in: Algebra 1 Keystone Prep: OERs 23-24 Bundle on Data Analysis
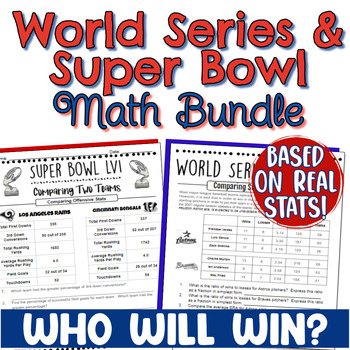
World Series & Super Bowl Math Bundle - Real World Sports Math
Looking for a way to engage your sports lovers in your middle or high school math class? This World Series and Super Bowl Math activity is based on real-world data and statistics, and asks students to determine who will win based on the actual teams.The bundle includes two resources: one for Super Bowl and one for World Series. Each resource is updated yearly to reflect the two teams playing in this year's series or game. The students are asked to make a prediction of the winner after analyzi
Subjects:
Grades:
6th - 9th
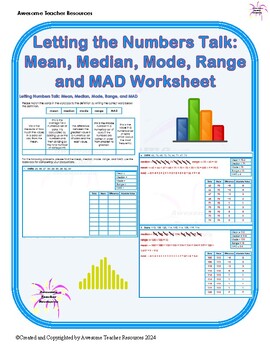
Letting Numbers Talk: Mean, Median, Mode, Range, and MAD Worksheet
The packet starts with suggestions for reinforcing and enriching learning related to data. This worksheet begins with the definitions of mean, median, mode, range, and MAD. Students are to write the correct word under the matching definition. Then students are given a data set. They are to find the mean, median, mode, range, and MAD. There is a substantial amount of space provided for students to complete their calculations. There is an answer key.
Subjects:
Grades:
5th - 8th
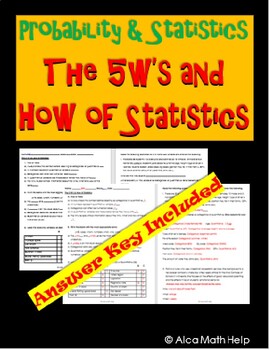
The 5W's & How of Statistics Worksheet, CP Stats, AP Stats, HW, Back-to-School
If you are looking for an easy to follow for students. You are at the right place. This is a quick and easy to follow activity sheet that brings across the concept clearly and precisely. Teachers in my department love this activity sheet. This is useful for CP Probability and Statistics, AP Statistics and Algebra 1 statistics unit.5W’s and How ObjectivesAt the end of the lesson students should be able to:1. Recall the history of statistics2. Define the 5W’s and How of statistics with examples3.
Subjects:
Grades:
8th - 12th, Higher Education, Adult Education, Staff
CCSS:
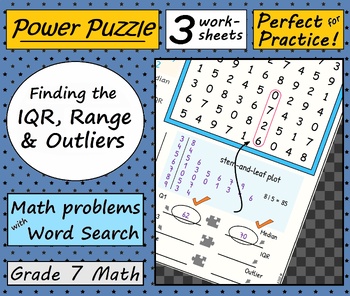
Grade 7 Math, Finding the IQR, Range & Outliers - bundled set of 3
Finding the IQR (Interquartile Range), Range, and Outliers is fun with Power Puzzle worksheets. Set of 3. Find the surprise Word Search answers inside! These 3 worksheets have a wide variety of problems, including sorted and unsorted data-sets, even and odd-numbered samples, decimals, and stem-and-leaf plots. Students are asked to find Q1, the median, Q3, the IQR, the sample range, and to identify any outliers.After solving these problems, students can look for their answers in a Number Search
Subjects:
Grades:
6th - 8th
Showing 1-24 of 103 results


