1,975 results
Graphing Common Core 3.MD.B.3 resources
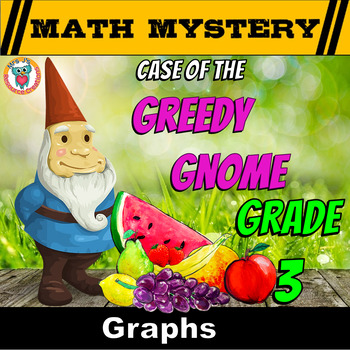
Graphs Review Math Mystery (Bars Graphs, Pictographs, Line Graphs, Tally Graphs)
3rd Grade Graphs Review Math Mystery Activity - Case of The Greedy Gnome. Easy prep! Just Print & Solve! Or go paperless with the new Google Slides option provided within your download.Engage and motivate your students while they practice and review graph skills. Completing the math will unlock important clues that will help them figure out who is the Greedy Gnome!⭐There is an optional Video Hook available to introduce this activity to your students in a fun way. Check it out in the preview
Grades:
2nd - 4th
Types:
CCSS:
Also included in: Complete Math Mystery Bundle 3rd Grade - Fun Math Review Activities
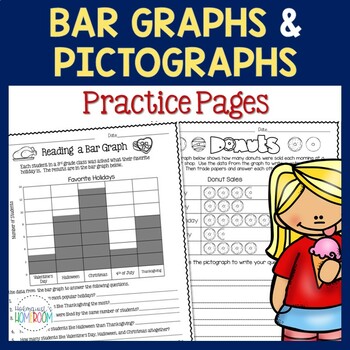
Bar Graphs & Pictographs - 3rd Grade
These bar graph and pictograph pages will give your students extra practice reading, interpreting, and creating bar graphs and pictographs.You may also be interested in my Fall Bar Graphs & Pictographs and Thanksgiving Bar Graphs and Pictographs!UPDATE: There is now a digital version that you can assign to your students in Google Classroom - it's ready to go with answer boxes and directions - all you have to do is assign it through TpT Easel! In the first two activities, students answer ques
Subjects:
Grades:
3rd
Types:
CCSS:
Also included in: Bar Graphs & Pictographs Year Long Bundle
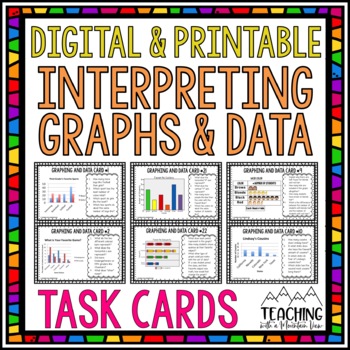
Graphing Task Cards | Interpreting Graphs and Data
Your students will love reviewing graphing and data with this set of 32 half-page Graphing Task Cards for interpreting graphs and data. Each of the graphing task cards is digital and printable and has 4 question prompts on each card, for a total of 128 questions on interpreting graphs ! These task cards are available in both a PRINTABLE version and a DIGITAL Google Slides Version.Types of graphs include:Bar GraphsDouble Bar GraphsLine GraphsDouble Line GraphsPictographsPie Graph (Circle Graph)
Subjects:
Grades:
3rd - 5th
Types:
Also included in: The ULTIMATE Math Task Card Bundle
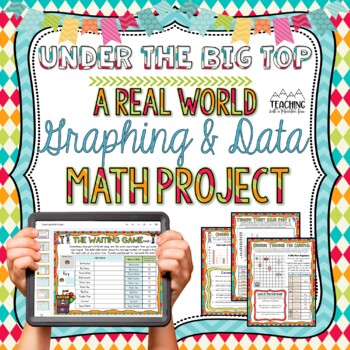
Graphing and Data Math Project
Your students will love working on this digital and printable 12-page graphing and data math project with a fun and engaging carnival theme! They will interpret data tables and graphs as well as create their own data tables and graphs. Each page also includes tasks and questions about each graph!The pages stand alone, so you can use a few of the pages or all of them depending on how much time you have and the skills your students are ready to review. (Making them PERFECT for DIFFERENTIATION!)W
Subjects:
Grades:
3rd - 6th
Types:
Also included in: Math Projects BUNDLE | Real-World Activities for Math Skills
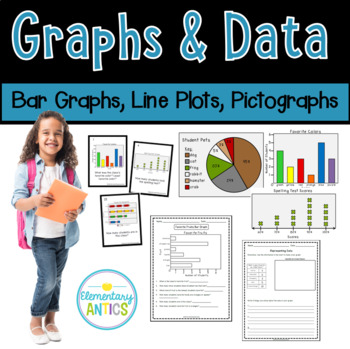
Graphs and Data- Bar Graphs, Line Plots, Pictographs
This graphs & data file features a variety of resources for practicing reading graphs and representing data using bar graphs, line plots, and pictographs. The Common Core Standards covered include 2.MD.D.10. There are 5 worksheets with various graphs and questions where students solve simple put-together, take-apart, and compare problems using information presented in the graphs.There are also 2 activities where students will use data presented in a chart to make their own bar graph and li
Subjects:
Grades:
1st - 3rd, Higher Education
Types:
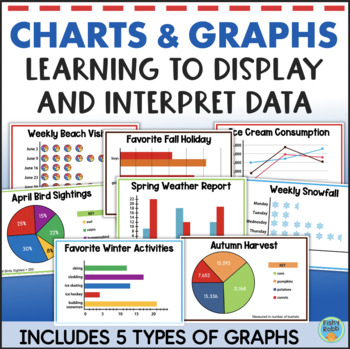
Math Graphing Activities Interpreting Graphs and Data Worksheets Line Pie Bar
Representing and interpreting data using graphs and charts is the focus of this math resource for upper elementary grades. It helps students explore and understand data analysis. For each activity, students will use a graph to answer questions about the data. They will also create another type of graph, chart, or table based on the information provided. This added step really helps students understand the various types of graphs and ways in which data can be displayed.These activities are perfec
Subjects:
Grades:
3rd - 5th
Types:
Also included in: Third Grade Math & Reading YEAR LONG BUNDLE 1500+ Pages
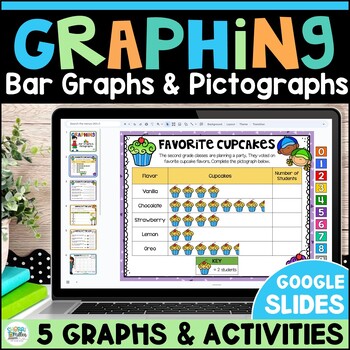
Graphing Activities - Bar Graphs, Pictographs & Picture Graphs Digital Resources
Engage your math students with these fun digital graphing practice activities! Students will love creating and reading bar graphs, picture graphs and pictographs through these interactive Google Slides activities. The NO PREP slides are a perfect worksheet alternative! ➡️ Click the PREVIEW above for more information! ⬅️ ⭐ Save 20% by buying the Bar Graphs and Pictographs BUNDLE BUNDLE! ⭐ Math skills include:Representing, creating, organizing, and reading data in✅ Bar Graphs✅ Pictographs✅ Pictur
Subjects:
Grades:
2nd - 3rd
Types:
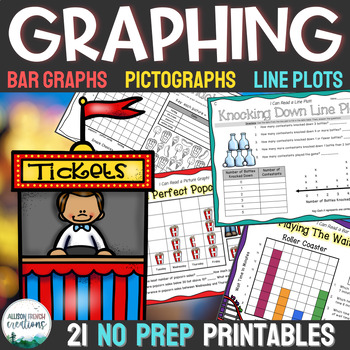
Graphing Worksheets Activity Packet - Pictograph, Line Plot, Bar Graph 3rd Grade
NO PREP GRAPHING UNIT! If you're looking for fun, engaging activities to teach your students about bar graphs, pictographs, and line plots...you've found it! This resource is a huge time saver for whole group math time, small group, and independent centers or workstations! Overview of What's Included (more details below)Pictographs:3 Read and Respond pictograph worksheets (analyze & interpret data from graph) 3 Create and Respond pictograph worksheets (use data to create graph) Bar Graphs:4
Subjects:
Grades:
2nd - 4th
Types:
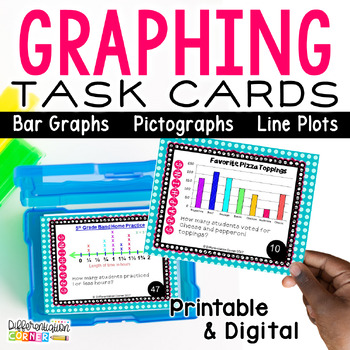
Graphing Task Cards: Line Plots, Bar Graphs and Pictographs Graphing Activities
Practicing data and graphing? This set of Graph Task Cards will help students read and interpret line plots, bar graphs, and pictographs. Use these cards as a graphing game in whole group or use as graphing practice in a math center!There are 60 unique printable & digital cards practicing Common Core Standards covering measurement and data for three types of graphs.I have them laminated in a basket for students to use during math center time. They work with partners, record their answer for
Subjects:
Grades:
3rd - 5th
Types:
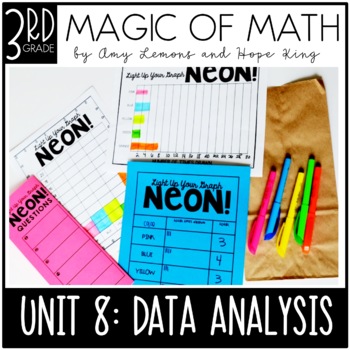
3rd Grade Magic of Math Bar Graphs, Pictographs, Line Plots, Frequency Tables
It's time to up the engagement when teaching data analysis and graphing in 3rd grade! Try this complete set of plans and hands-on activities for analyzing data and collecting, graphing (bar, pictograph, line plot, and frequency tables), and a fun graphing project!The Magic Of Math Unit 8 for THIRD GRADE focuses on: Week 1: Bar Graphs (scales of 1 or more) Week 2: Pictographs (scales vary) Week 3: Line Plots with Measuring to the Nearest Quarter and Half Inch Week 4: Frequency Tables and Gr
Grades:
3rd
Types:
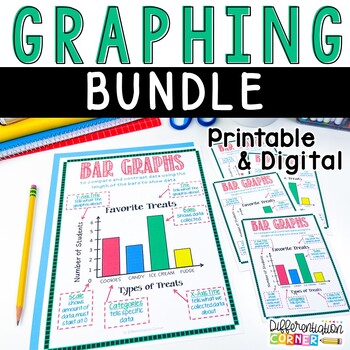
Graphing Activity Bundle: Bar Graphs, Pictographs, Line Plots Digital Printable
Your students will love these engaging data and graphing activities for bar graphs, pictographs and line plots! Printable graphing worksheets, anchor charts, and digital graphing activities are all ready for you in a snap to save you time!Colorful graphing anchor charts for bar graphs, line plots and picture graphs included in both large and small copies! Students will enjoy graphing practice with these differentiated graphing worksheets. PRINTABLES-✔Anchor Charts Bar Graph Pictograph /
Subjects:
Grades:
3rd - 5th
Types:
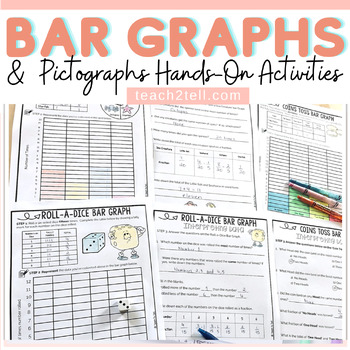
Bar Graphs Worksheets & Bar Graphs Activities Pictographs Picture Graphs
This collection of interactive worksheets feature interpreting data in bar graphs and pictographs. Data is collected using concrete materials such as visuals, dice, spinners, coins and M&M’s. This data is then represented in bar graphs and interpreted. The section on pictographs requires collected data to be interpreted.US and British English spellings and terminology files included.These no-prep printables facilitate students to move from the concrete to the abstract. Graphs target students
Subjects:
Grades:
3rd - 6th
Types:
CCSS:
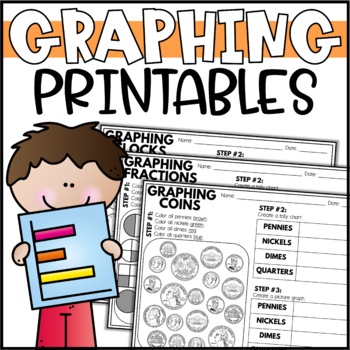
Data and Graphing Worksheets - Bar Graphs, Picture Graphs & Tally Charts
These graphing activities will challenge your students during your graphing unit! These data and graphing worksheets spiral other math skills at the same time and are perfect for enrichment during math centers. Each 2-page worksheet centers on a different math topic:•Identifying Coins•Telling Time•Identifying 3D Shapes•Identifying 2D Shapes•Odd/Even numbers, Greater Than/Less Than sign• FractionsStudents will need to create a tally chart, a picture graph and a bar graph for each data set, and an
Subjects:
Grades:
2nd - 3rd
Types:
Also included in: Data and Graphing Activities Bundle
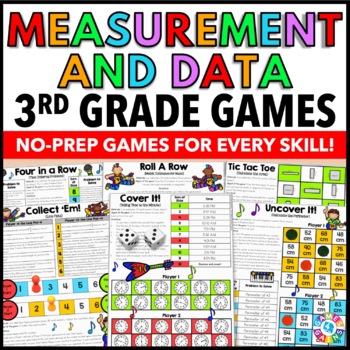
3rd Grade Measurement Worksheet Games Elapsed Time, Area & Perimeter, Line Plots
Motivate your 3rd graders with these fun, no-prep measurement and data worksheet games! This 3rd Grade Measurement & Data Games Pack includes 21 engaging games to practice telling time, elapsed time, measurement units, bar graphs, line plots, area and perimeter, and more. These measurement games are perfect for math centers, partner work, early finishers, and more!These exciting games cover these 3rd grade measurement and data skills:Time:Telling time to the nearest minuteDetermining the tim
Subjects:
Grades:
3rd
Types:
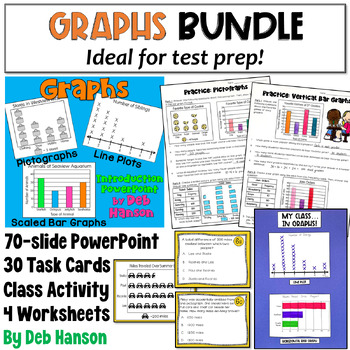
Graphs Bundle: Scaled Bar Graphs, Pictographs, and Line Plots
This graphing bundle has everything you need to teach third and fourth-grade students about representing and interpreting data. The activities in this math bundle make learning how to interact with common types of graphs fun and easy! Students love the activities while teachers love the convenience of these no-prep resources that can be used year after year! These graphing activities can be used for test prep, review, or introduction of math concepts related to graphing. The activities in this b
Subjects:
Grades:
3rd - 4th
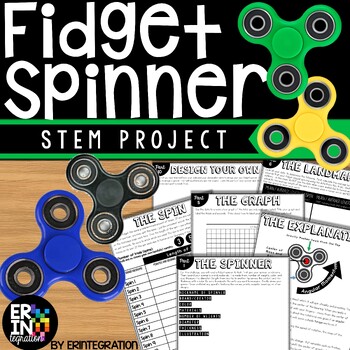
Fidget Spinner STEM Challenge Activities and Science Experiment
The ORIGINAL Fidget Spinner Stem Challenge & Science Lab! Discover the science of fidget spinners with this engaging and low-prep STEM activity. Practice scientific method with an exploration of variables, data collection, graphing, mean/average, and more...all while having fun!This self-paced, fidget spinner activity is print-and-go. Each activity sheet guides students through the project. STEM Challenge Overview:Students will use the included visual directions, graphic organizers, chart
Subjects:
Grades:
3rd - 6th
Types:
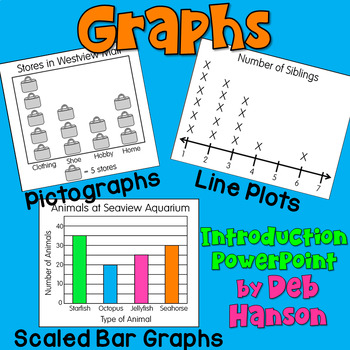
Graphs PowerPoint and Notes: Pictographs, Scaled Bar Graphs, Line Plots
Are you searching for a step-by-step PowerPoint that can be used to introduce graphing concepts to your students in a way that will grab their attention? You've come to the right place! Teach third and fourth-grade students about graphing concepts with this 70-slide PowerPoint lesson. Students will have many opportunities to draw and interpret the various types of graphs. It includes frequency tables, picture graphs, pictographs, scaled picture graphs, scaled bar graphs, and line plots. Use his
Subjects:
Grades:
3rd - 4th
Also included in: Graphs Bundle: Scaled Bar Graphs, Pictographs, and Line Plots
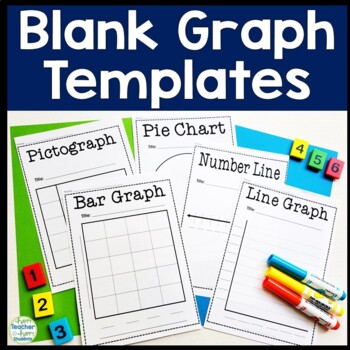
Blank Graph Templates: Bar Graph, Pie Chart, Pictograph, Line Graph, Number Line
Blank Graph Templates: Full & Half-Page Templates This resource includes 6 blank graph templates: blank Bar Graph template (2 size options), blank Pie Chart template, blank Pictograph template, blank Line Graph template & a blank Number Line template. Each blank graph includes a full page and half-page (2 per page) option.These blank graph templates can be used in unlimited ways in a classroom. Happy teaching!** Click HERE for a Graphing Test (includes Bar Graph, Pictograph, Line Graph &
Subjects:
Grades:
K - 3rd
Types:
Line Plots Bar Graphs & Pictographs End of Year Escape Room Digital Activities
Want to get your students engaged with Bar Graphs, Pictographs and Line Plots for your Graphing unit? Students will be challenged to solve math puzzles and clues and find the secret codes in this Emoji themed digital escape room. This NO PREP, high interest game is a perfect test prep review and worksheet alternative! ⭐ JUST UPDATED TO GOOGLE SLIDES FORMAT! ⭐➡️ Click the PREVIEW above to get a closer look and see more info! ⬅️Students will be highly motivated in this exciting escape room to com
Subjects:
Grades:
3rd - 5th
Types:
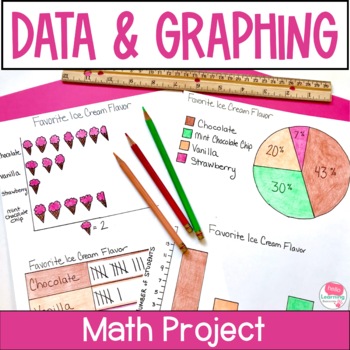
Data and Graphing Project - Real World Math Project Based Learning Activities
This data and graphing project gives your students a meaningful way to apply their data and graphing skills. Use this real world math project as an end of unit activity, enrichment activity or assessment. Easy to use and fun for students!Click the PREVIEW button above to see everything that is included in this fun math project!⭐ This resource includes:teacher information, directions and sample schedulesupply listgrading rubricstudent direction sheettwo data collection sheets (one for open ended
Subjects:
Grades:
4th - 6th
Types:
CCSS:
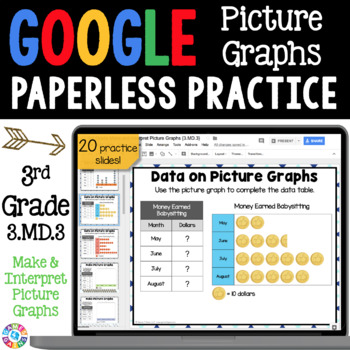
3rd Grade Making & Interpreting Picture Graphs or Pictographs Google Worksheets
Google Paperless Practice - 3rd Grade Make & Interpret Picture Graphs {3.MD.3}
Engage your students with this interactive DIGITAL resource that works with Google Slides™. No more copies to be made, no more printer ink, and no more lost papers!
With this 20-slide digital resource, your students will practice making picture graphs and interpreting data on picture graphs. Students will love interacting with the movable pieces and typing their responses on these slides!
This resource was c
Subjects:
Grades:
3rd
Types:
CCSS:
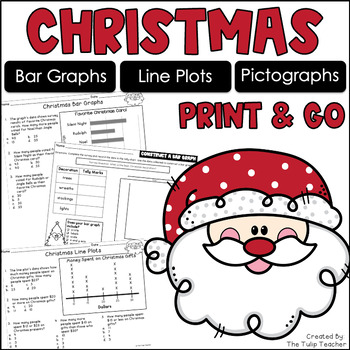
Christmas Graphs with Bar Graphs, Pictographs, Line Plots, Anchor Charts
Looking for print and go Christmas graphing activities and anchor charts? This set of holiday worksheets includes 2 bar graphs, 2 pictographs, and 2 line plots with multiple choice questions. Questions cover addition, subtraction, and multiplication (basic facts). The packet also includes student surveys to create their own Christmas themed bar graph and pictograph. A measuring to the nearest half inch line plot is available. Anchor charts for bar graphs, line plots, pictographs, and comparing a
Subjects:
Grades:
2nd - 3rd
Types:
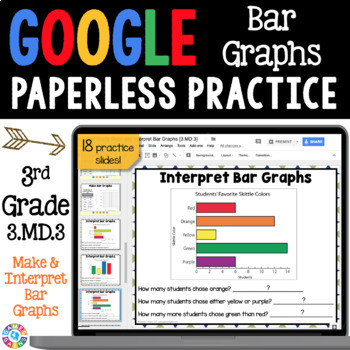
Data & Graphing Activity Worksheets Interpret Bar Graphs Practice 3rd Grade Math
Engage your 3rd grade students in practicing data and graphing skills with these interactive bar graphs activities for Google Slides™. While working through these digital graphing math worksheets, your students will practice making bar graphs using data and interpreting data on bar graphs. With 18 slides of activities included, you'll have a full supply of ready-to-go practice & review opportunities for your bar graphs lessons!These 3rd grade bar graphs worksheets work with Google Slides™. J
Subjects:
Grades:
3rd
Types:
CCSS:
Data Sorting and Picture Graphs Worksheets & Activities | Pictographs
Help your students master the data standards with this fun and engaging picture graphs worksheets and activities set. In this Data Sorting and Picture Graphs Worksheets and Activities resource, students learn about data sorting and picture graphs the fun, hands-on way. You will love how easy this print-and-go resource makes your teacher life! Your students will love drawing, cutting, pasting, coloring, using concrete materials, like a die, a spinner, a coin, and a bag of candies to complete thes
Grades:
1st - 3rd
Types:
CCSS:
Also included in: Data & Graphing Activities | Bar Graphs and Pictographs Worksheets
Showing 1-24 of 1,975 results


