12 results
Graphing Common Core RST.9-10.7 resources

Scientific Method Worksheets with Experimental Design Data Analysis and Graphing
SAVE 25% OFF LIST PRICES! Build foundational SCIENCE SKILLS such as experiment design, graphing, and data analysis! This bundle includes 8 worksheets that give your students structured support to practice these skills. Use in a scientific method unit, throughout the school year to reinforce skills, or as emergency sub plans. Each worksheet is a stand-alone lesson, so this set of resources can be used at the same time or completely independently of each other.Please click VIEW PREVIEW (above)
Subjects:
Grades:
7th - 10th
CCSS:
NGSS:
MS-LS2-1
, HS-LS2-1
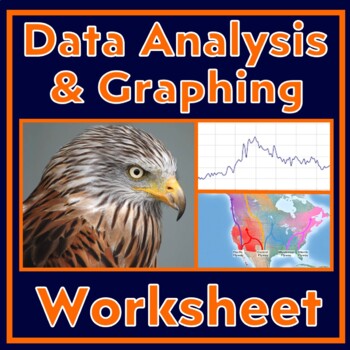
Scientific Method Worksheet Graphing and Data Analysis Practice (Falcons)
Use this data analysis and graphing worksheet to build GRAPHING and DATA ANALYSIS skills. This worksheet provides a data table about the distances that falcons travel. Students follow directions that lead them through graphing and data analysis skills, including making a line graph and then analyzing it.Instruction is built into the worksheet.Students will practice the following skills in this activity:Setting up line graphs, including choosing intervals, labeling axes, and writing graph titles.
Subjects:
Grades:
6th - 9th
CCSS:
NGSS:
MS-LS2-2
, MS-LS2-1
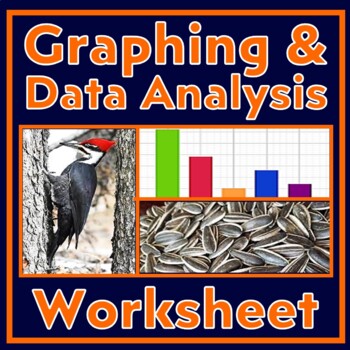
Graphing and Analyzing Data Activity with Scientific Method (Woodpeckers)
Use this data analysis and graphing worksheet to build GRAPHING and DATA ANALYSIS skills. This worksheet provides a data table from an experiment designed to find out which food woodpeckers prefer. Students follow directions that lead them through foundational graphing and data analysis skills, including making a bar graph and then analyzing it. Instruction is built into the worksheet. Students will practice the following skills in this activity:Setting up bar graphs, including choosing inter
Subjects:
Grades:
7th - 10th
CCSS:
NGSS:
MS-LS2-2
, MS-LS2-4
, HS-LS2-2
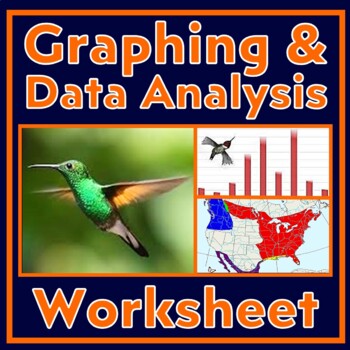
Scientific Method Worksheet Graphing and Analyzing Data Activity (Hummingbirds)
Build GRAPHING and DATA ANALYSIS skills! This worksheet provides a data table related to hummingbird migration. Students follow directions that lead them through graphing the data and analyzing it. Students will practice the following skills in this activity:Setting up bar graphs, including choosing intervals, labeling axes, and writing graph titles.Generating a bar graph from provided data.Pulling data from their graph.Data analysis that requires using data as evidence to support conclusions.R
Grades:
7th - 10th
CCSS:
NGSS:
MS-LS2-4
, MS-LS2-1
, HS-LS2-1
, HS-LS2-2
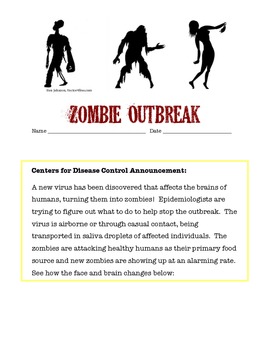
Investigating the Spread of a Viral Outbreak
Students in grades 5 - 9 model the spread of an infectious disease under the entertaining theme of a zombie outbreak. One student unknowingly is patient zero and students simulate the spread of an airborne illness. This highly engaging activity covers health topics, nature of science, and math skills as students graph data in a line plot. Higher level students can be challenged to find the function of the exponential growth of the outbreak.
Subjects:
Grades:
6th - 9th
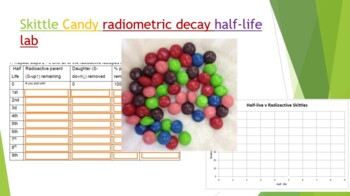
Skittle Radiometric Decay Half-life Lab
Did you know you can use Skittles candy to demonstrate absolute dating and radiometric decay! Buy a 1-4 lb bag at your local bulk warehouse store for savings. This lab is a great way to show how isotopes decay by shaking a plate full of random skittles. Students use Skittles to observe "Isotopes" decay over each half life. At the end of the lab (and only IF they have done all their work) they can enjoy their "daughter products". Skittles were used because they are durable, hypoallergenic, and th
Subjects:
Grades:
8th - 12th, Higher Education, Adult Education
Types:
NGSS:
HS-PS1-8
, HS-PS1-1
, HS-PS1-4
, HS-PS1-6
, MS-PS1-4
...
Also included in: Hands-on Science Semester Labs Bundle
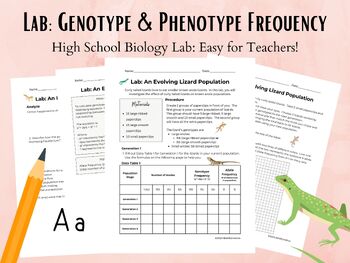
Lab: Genotype and Phenotype Frequency in Lizard Populations
This is a High School Biology lab where students will model changes in a populations traits. They will calculate genotype and phenotype frequency and monitor its changes over the course of 4 generations of lizards. Students will use A data table2 line graphthe Hardy Weinberg formula for genotype frequency Answer analysis questions. Teacher setup is minimal. Supplies are inexpensive and easily found in schools or at an office supply store. NGSS Standard CoveredLS3: Heredity: Inheritance and Var
Grades:
9th - 12th, Higher Education
Types:
CCSS:
NGSS:
HS-LS3-3
All About Me: Graphing Digital Activity
Product DescriptionAll About Me Worksheet: A First Week of School ResourceLooking for an activity to learn more about your students while allowing them to get to know each other and engage in graphing skills? This ice breaker is for you! Created for the elementary to middle school student, this resource (created for use with PowerPoint and Google platforms, as well as being Easel ready) will allow students to introduce themselves to the class, followed by the opportunity to practice their graphi
Grades:
3rd - 7th
Types:
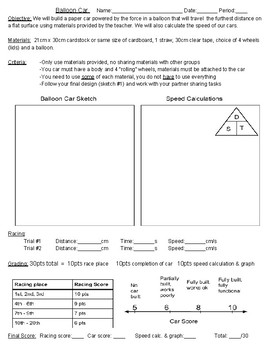
Balloon Car Project - NGSS
Objective: We will build a paper car powered by the force in a balloon that will travel the furthest distance on a flat surface using materials provided by the teacher. We will also calculate the speed of our cars.Materials: 21cm x 30cm cardstock or same size of cardboard, 1 straws, 1 bamboo skewer, clear tape, choice of 4 wheels (lids) and a balloon.
Subjects:
Grades:
8th - 9th
CCSS:
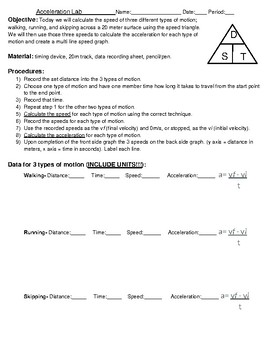
Acceleration lab - NGSS
In this lab students will calculate the speed of three different types of motion; walking, running, and skipping across a 20 meter surface using the speed triangle. They will then use those three speeds to calculate the acceleration for each type of motion and create a multi line speed graph.
Subjects:
Grades:
9th
CCSS:
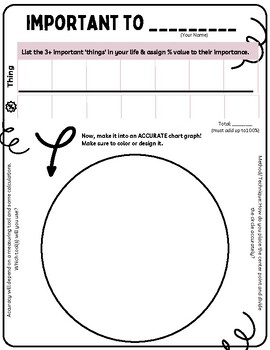
'Important to Me' First Day Activity- Chart Graph Assessment
This is a simple first day activity where students share in a table the things that are important to them, assign them a % value and visually translate on a chart graph. They can use the measuring tools of their choice to make it as accurate as possible.Preparation requires:1. Printing this handout and 2. Providing students with rulers, pencils, protractors, and compasses to choose from.Hints are placed around the chart to get students to think about how to chart graph.
Subjects:
Grades:
6th - 12th
Types:
CCSS:
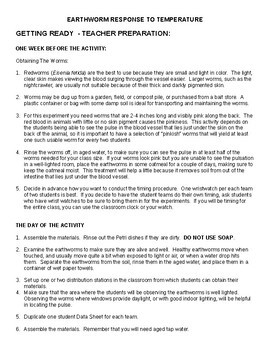
Earthworms Response to Temperature
This is a lab for Middle School and High School Science classes. It uses Red Wigglers, Eisenia fetida, to manipulate temperature variables to affect the worm's pulse rate. Red Wigglers are easy to work with and allow students to see the blow flow through the closed circulatory system and calculate the pulse rate of the worm. This lab uses graphing and data collection to help students understand how science accumulates data to make inferences about how conditions affect animals.
Showing 1-12 of 12 results


