826 results
Statistics Common Core 6.SP.B.5 resources
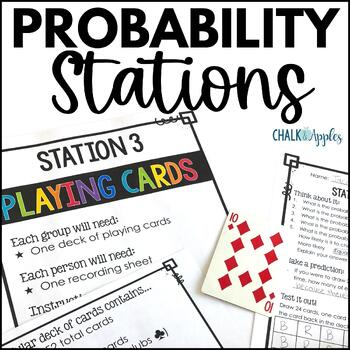
Chance & Probability Activities: Hands-On Theoretical & Experimental Probability
Make teaching probability exciting with these hands-on fun probability activities! This set includes 6 low-prep chance and probability stations perfect for exploring theoretical and experimental probability and critical thinking. Quick and easy setup plus clear student directions make these activities perfect for centers or substitute days, too!Lead your students to discover concepts of probability by exploring it on their own before teaching probability rules. Students will love exploring proba
Subjects:
Grades:
5th - 7th
Types:
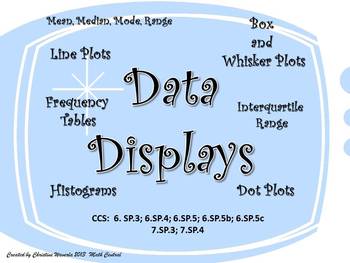
Data Displays: Line Plots, Histograms, Box and Whisker Plots, Frequency Tables
This is one of my favorite teaching tools! I created this Data Display set of worksheets this year for my 6th grade class. My students loved using these worksheets to practice their new skills. Each worksheet provides plenty of room for students to create their data displays and answer questions based on the data. Questions ask students to find the mean, median, mode, range, interquartile range, and percentages.These worksheets are fully aligned with the Common Core Curriculum.CCS: 6.SP.3; 6.SP
Subjects:
Grades:
6th - 8th
Types:
Mean, Median, Mode & Range Whodunnit Activity - Printable & Digital Game Options
Nothing like a good criminal investigation to liven up mean, median, mode, and range! Based off my popular CSI projects, I have created Whodunnits? The Whodunnits plan to focus on single content topics as opposed to units and will focus more on skill building than application. Every day can't be a project day, so Whodunnits can be an engaging out of their seat activity to practice important skills. In a Whodunnit?, students will work in teams to solve 10 practice problems that increase in diffic
Subjects:
Grades:
6th - 12th
Types:
Also included in: Pre-Algebra Whodunnit Activity Bundle - Printable & Digital Game Options
Data & Statistics Unit | Measures of Center, Dot and Box Plots, & Histograms
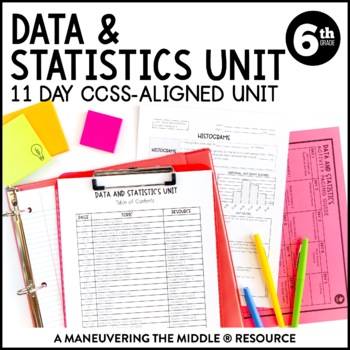
An 11 day CCSS-Aligned Statistics Unit - including statistical questions, describing data, and analyzing data with dot plots, box plots, and histograms. Students will understand measures of center and variability and how they relate to displays of data. Students will practice with both skill-based problems, real-world application questions, and error analysis to support higher level thinking skills. You can reach your students and teach the standards without all of the prep and stress of creatin
Subjects:
Grades:
6th
Types:
Measures of Central Tendency Doodle Notes (Mean, Median, Mode, & Range)
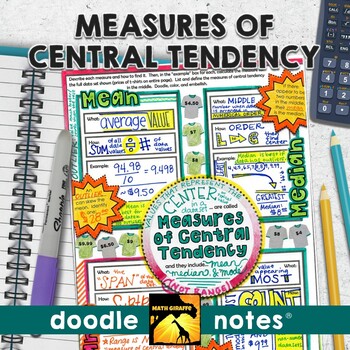
Mean, Median, Mode, and Range (Measures of Central Tendency): "doodle notes" - visual note taking pages with interactive tasks for building stronger retention of measures of center (mean, median, mode, and range) for your middle school statistics unit in Pre-AlgebraBoost your students' focus and memory! The blend of graphic and linguistic input in these guided visual notes helps students' brains to convert the information to long-term memory more easily.When students color or doodle in math clas
Subjects:
Grades:
6th - 8th
6th Grade Statistics Project: Analyzing Zombie Virus with Dot Plots and Mean
I created this project as a way for my 6th graders to practice their statistical skills. They loved it! They get to pretend to be epidemiologists studying a virus outbreak that is turning people into zombies. It's a fantastic way for students to see how statistics is used in the "real world" - they were also very interested to learn about the field of epidemiology. The Project: Students are given data about infected people who are quarantined in an airport. They are also given two maps of the US
Subjects:
Grades:
5th - 7th
Types:
Chance and Probability Activities Print and Digital Worksheets |Google Classroom
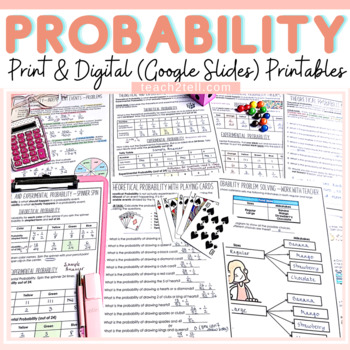
Are you teaching your students all about chance and probability and looking for fun hands-on probability activities? This print and digital (google slides) bundle of probability worksheets will reinforce the understanding of theoretical probability, experimental probability, language of chance, sample space, predictions, lists, tree diagrams, dependent probability events and independent probability events.Both US and British English spelling and terminology included.Overview of Activities1. The
Subjects:
Grades:
4th - 8th
Types:
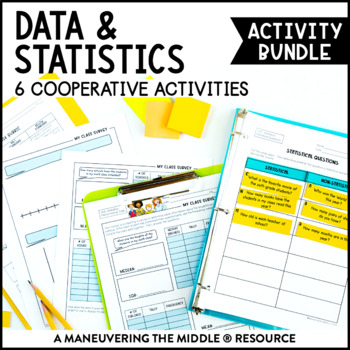
Data & Statistics Activity Bundle | Measures of Center, Histograms, & Box Plots
This Data and Statistics Activity Bundle includes 6 classroom activities to support statistical questions, histograms, box plots, measures of center and measures of variability. These hands-on and engaging activities are all easy to prep! Students are able to practice and apply concepts with these data and statistics activities, while collaborating and having fun! Math can be fun and interactive! Standards: CCSS (6.SP.1, 6.SP.2, 6.SP.3, 6.SP.4, 6.SP.5) and TEKS (6.12A, 6.12B, 6.12C, 6.12D, 6.13
Subjects:
Grades:
5th - 7th
Types:
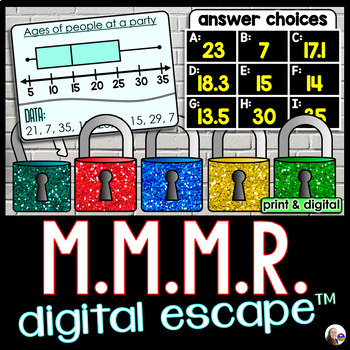
Mean Median Mode and Range Digital Math Escape Room Activity
An engaging math escape room for reviewing measures of central tendency. Students must unlock 5 locks by finding mean, median, mode and range in 5 sets of data. Questions are grouped 4 per puzzle, resulting in five 4-letter codes that will unlock all 5 locks.Data is presented in:stem and leaf plot, raw data set, box and whiskers plot, tabledot plot. The entire activity is housed in one GOOGLE Form. There are no links to outside websites. The 4-letter codes are set with answer validation so that
Subjects:
Grades:
6th - 8th
Types:
Also included in: Middle School Math Digital Activities Bundle
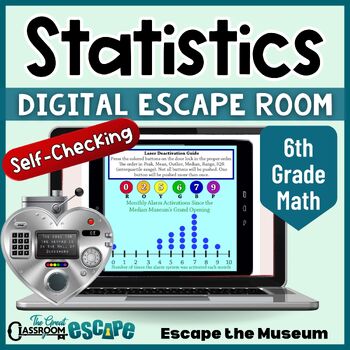
6th Grade Math Data Analysis & Statistics Activity Digital Escape Room Game
Find the median, read the box plot, interpret the frequency table, and unlock the door! This 6th grade math activity based on statistics and probability standards will put your students statistical skills to the test. Your students are volunteer docents at the Median Museum. After the security system locks everyone in, they will need to use their knowledge of statistics to escape the museum. This engaging digital escape room is easy for teachers to implement. The breakout process is fully autom
Subjects:
Grades:
6th - 7th
Types:
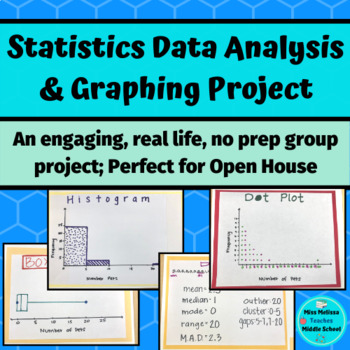
Statistics Project: Data Analysis & Graphing- real life, no prep
This statistics project is intended as a closure for your sixth grade statistics unit and aligns with ALL of the sixth grade statistics and probability common core state standards. In groups, students work together to choose a statistical question to ask the class. Once the class is surveyed, the group works together to create a frequency table, a dot plot, a histogram, and a box and whiskers plot. After creating their graphs, the groups analyze their data by looking at the mean, median, mode ra
Subjects:
Grades:
6th - 7th
Types:
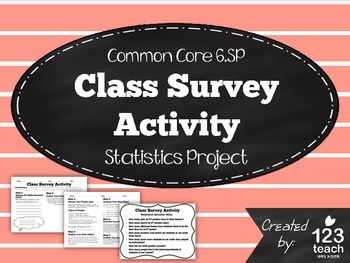
Class Survey Activity - Common Core 6th Grade Statistics Project
This "Class Survey Activity" includes a two page activity aligned to common core standards for statistics and probability (6.SP).
Students will have to come up with a statistical question to survey their classmates. Then, the students will record their results, create a graph, and analyze their data. Lastly, the students will present their results with the class. With my class, I give the students at least a full class period to complete the activity, and then it takes another class perio
Subjects:
Grades:
5th - 7th
Types:
Also included in: Math Assessments and Review Activities BUNDLE for 6th Grade Common Core
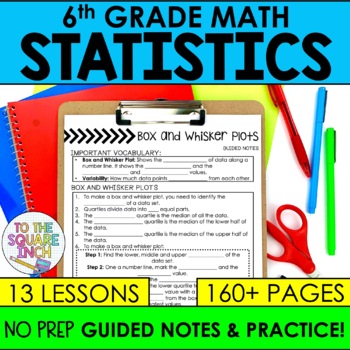
6th Grade Statistics and Probability Notes & Activities Unit | Data Sets
Looking for 6th grade guided notes for Statistics and Probability that are designed to help your students thrive and save you the time and energy of writing and designing them yourself? These NO PREP guided notes are a classroom-proven resource that will have your students proficient in entire 6th Grade Math statistics and probability common core standards. With a comprehensive design, these notes offer a structured approach that can be differentiated for every level of learner for the entire u
Subjects:
Grades:
5th - 7th
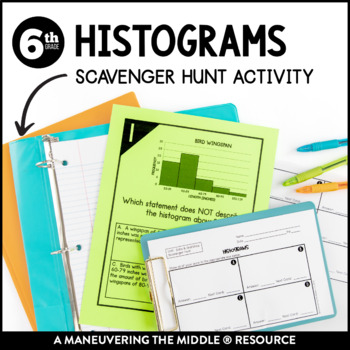
Histograms Scavenger Hunt | Interpreting Histograms Activity
This Histograms Scavenger Hunt consists of 10 clue cards where students must use the clue to interpret histograms. This activity focuses on analyzing histograms and determining which statements are represented in the histogram. This activity is great for in class practice! Students can get out of their seats and move around, while still applying their understanding of data and statistics. Students are able to practice and apply concepts with this histograms activity, while collaborating and havi
Subjects:
Grades:
5th - 7th
Types:
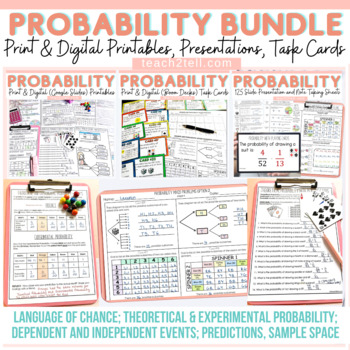
Chance and Probability Activities Theoretical & Experimental Probability Bundle
Are you teaching your students all about chance and probability and looking for fun hands-on probability activities? This print and digital bundle of worksheets, task cards, slideshows and note-taking sheets on Probability will reinforce the understanding of theoretical probability, experimental probability, language of chance, sample space, predictions, lists, tree diagrams, dependent probability events and independent probability events.Both US and British English spelling and terminology file
Subjects:
Grades:
4th - 7th
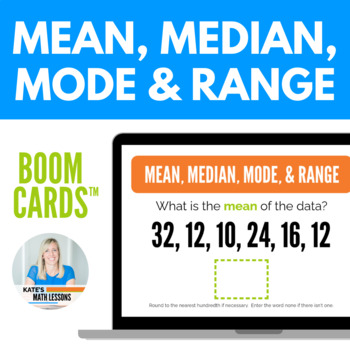
Mean, Median, Mode, & Range Digital Activity Boom Cards™
Working on mean, median, mode, and range? This set of 34 digital task cards is a great way to help students practice finding measures of central tendency: mean, median, mode, and range of a data set (MMMR). Students are shown one question at a time and get instant feedback! The first few cards help students review the meaning of each term before finding the measures of central tendency. Data sets are given as lists of numbers, in tables, or in word problems (you can hide any cards you don't
Subjects:
Grades:
5th - 7th
Types:
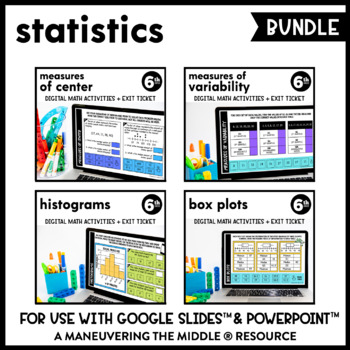
Statistics Digital Math Activity Bundle | Measures of Center | Google Slides
These supplemental digital math activities can be used to support data and statistics concepts. They are interactive (drag and match, using the typing tool, using the shape tool) and paperless through Google Slides™ and PowerPoint™. Topics Included:Measures of Center (4 interactive slides + exit ticket)Measures of Variability (4 interactive slides + exit ticket)Histograms (4 interactive slides + exit ticket)Box Plots (4 interactive slides + exit ticket)What is included?1. Paperless Math Activit
Subjects:
Grades:
6th
Types:
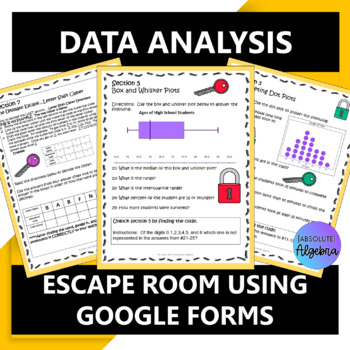
Data Analysis Digital Digital Escape Room using Google Forms
#overtherainbow Data Analysis Digital Escape Room Google FormsGive your students comprehensive practice on data analysis including variability, mean, median, mode, range, IQR, box and whisker, dot, stem and leaf plots, histograms, relative frequency tables, and more! This is a NO PREP Escape Room using technology! Just hand your students the worksheet, give them URL for the google form and they're ready to go!This resource includes:VariabilityMean, Median, Mode, Range, and Interquartile Range (I
Subjects:
Grades:
6th - 7th
Types:
Also included in: Middle School Math Activities Bundle
Statistics Project
This is a survey project that is aligned to the 6th and 7th Grade Common Core (6.SP.1 to 6.SP.5 and 7.SP.1 to 7.SP.4). Students survey a random sample and then calculate the mean, median, range, and mode of the data. They also must create different data displays such as histograms and box and whisker plots. This project is an all encompassing activity that gets students thinking about statistics and loving math! They prove their understanding of the topics by asking questions they are interested
Grades:
6th - 7th
Types:
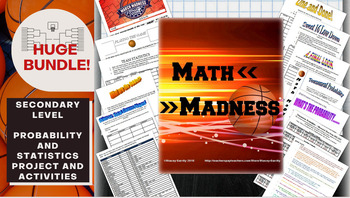
Math March Madness Full Tournament Project {BUNDLE}
Harness the excitement of NCAA March Madness with this huge project for secondary math teachers that follows all stages of the tournament! This Common Core aligned bundle comes with bonus parts not sold individually in my store so you can create a rich immersion in the tournament, practice probability and statistics and learn some interesting new ones along the way! Save $3 plus get bonus content by bundling!You can pick and choose which parts you would like to incorporate, or follow my schedu
Subjects:
Grades:
6th - 12th, Higher Education
Types:
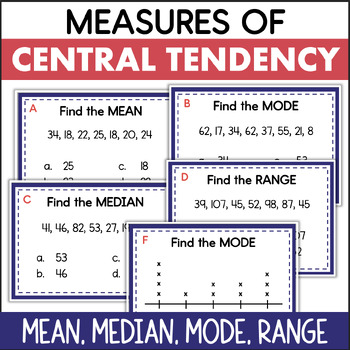
Mean Median Mode Range Measures of Central Tendency Data Task Cards
These data task cards are a great way for students to practice analyzing data to find the mean, median, mode, and range!There are several types of questions, all addressing measures of central tendency. Some require students to interpret a data set of whole numbers. Others involve data presented in a line plot. The last type of question requires the student to choose the correct method for finding the mean, median, mode, or range.This math resource includes:16 task cardsrecording sheetanswer key
Subjects:
Grades:
5th - 7th
Types:
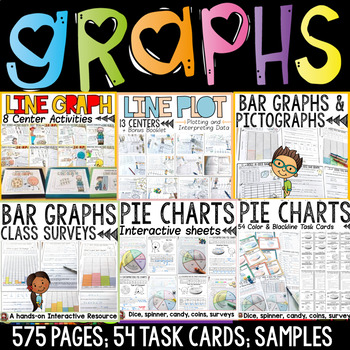
Bar Graphs Pictographs Line Graphs Line Plots Pie Charts Data Collection Bundle
The graphing bundle features interactive activities for creating and interpreting bar graphs, pictographs, line graphs, line plots and pie charts. Your entire graphing unit for a year!Separate folders featuring both British English and US spellings and terminology included.Great quality and value for this whopping 575 + page unit on graphing! Data is collected and interpreted using concrete materials such as visuals, dice, spinners, coins and other real-life objects and contexts. Further details
Subjects:
Grades:
2nd - 6th
Types:
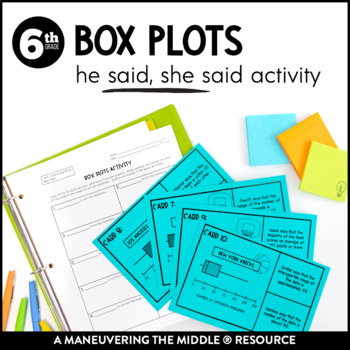
Box Plots Error Analysis | Measures of Center & Variability Box Plot Activity
This Box Plots He Said, She Said Activity consists of 10 cards where students must analyze errors and justify their responses. This activity focuses on box plots and their measure of center and variability. This activity works best in a collaborative setting where students will use mathematical discourse to discuss and defend their responses. An excellent way to incorporate higher level thinking skills! Students are able to practice and apply concepts with this box plots activity, while collabo
Subjects:
Grades:
5th - 7th
Types:
Analyzing Plots, Graphs, and Tables using Measures of Central Tendency
This product provides students the opportunity to analyze data presented in different ways. By making calculations and analyzing data, students make conjectures and justify them using mathematical reasoning and evidence!What is included?This product contains 8 student work pages. Each work page contains a set of data displayed graphically with accompanying questions. The data displays included are 2 dot plots, 2 bar graphs, 2 frequency tables, and 2 stem-and-leaf plots. Students are required
Subjects:
Grades:
5th - 11th
Types:
Showing 1-24 of 826 results


