10 results
Statistics Common Core RH.6-8.7 resources
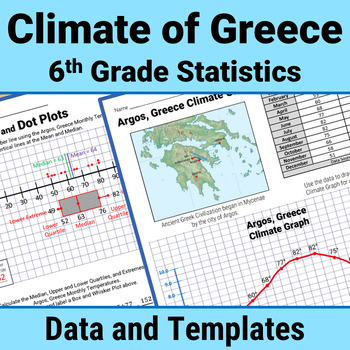
Greece Geography 6th Grade Statistics Box Plot Histogram Mean Median Activity
Enrich your study of Ancient Greece using 6th Grade stats skills to analyze Greek climate data. Calculate Measures of Central Tendency (mean, median, mode, range) and Mean Absolute Deviation. Master Data Display with Box and Whisker Plots, Histograms, Dot Plots, Stem and Leaf Charts. Write Statistical Questions. Analyze Data Distribution and Data Variability.All with climate data (temperature and precipitation) from Greece!This Print and Go STEM/STEAM PBL resource includes 70+ pages of climate d
Subjects:
Grades:
6th - 8th
NGSS:
MS-ESS2-6
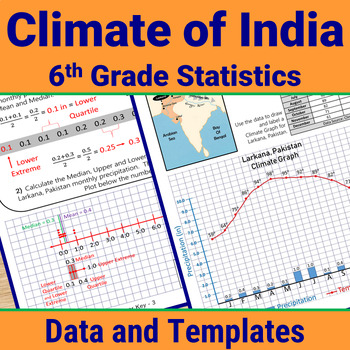
India Geography 6th Grade Statistics Box Plot Histogram Mean Median Activity
Enrich your study of India using 6th Grade stats skills to analyze India climate data. Calculate Measures of Central Tendency (mean, median, mode, range) and Mean Absolute Deviation. Master Data Display with Box and Whisker Plots, Histograms, Dot Plots, Stem and Leaf Charts. Write Statistical Questions. Analyze Data Distribution and Data Variability.All with climate data (temperature and precipitation) from ancient Indian sites!This Print and Go STEM/STEAM PBL resource includes 70+ pages of clim
Subjects:
Grades:
6th - 8th
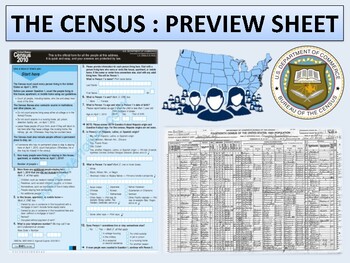
The Census - Cross-Curricular Mini Unit
With the 2020 census coming up, this mini unit is the perfect addition to any Social Studies or Math class. Included are four main lessons covering the history and functions of the census with a variety of geographic and statistical activities culminating in a final mock-census project. Please download the preview sheet for more details.Lesson one of the unit is available as a free download here.Included in the product file are reading and work sheets, answer keys, lesson plans, and a PowerPoi
Grades:
7th - 12th
Types:
CCSS:
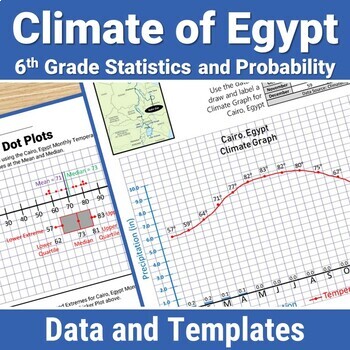
Egypt Geography 6th Grade Statistics Box Plot Histogram Mean Median Activity
Enrich your study of Ancient Egypt using 6th Grade stats skills to analyze Egypt climate data. Calculate Measures of Central Tendency (mean, median, mode, range) and Mean Absolute Deviation. Master Data Display with Box and Whisker Plots, Histograms, Dot Plots, Stem and Leaf Charts. Write Statistical Questions. Analyze Data Distribution and Data Variability.All with climate data (temperature and precipitation) from Egypt!This Print and Go STEM/STEAM PBL resource includes 70+ pages of climate dat
Subjects:
Grades:
6th - 8th
NGSS:
MS-ESS2-5
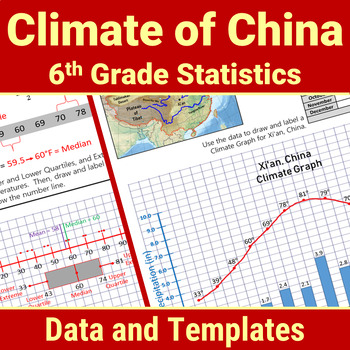
China Geography 6th Grade Statistics Box Plot Histogram Mean Median Activity
Enrich your study of Ancient China using 6th Grade statistics and Probability skills to analyze China climate data. Calculate Measures of Central Tendency (mean, median, mode, range) and Mean Absolute Deviation. Master Data Display with Box and Whisker Plots, Histograms, Dot Plots, Stem and Leaf Charts. Write Statistical Questions. Analyze Data Distribution and Data Variability.All with climate data (temperature and precipitation) from China!This Print and Go STEM/STEAM PBL resource includes 70
Subjects:
Grades:
6th - 8th
NGSS:
MS-ESS2-6
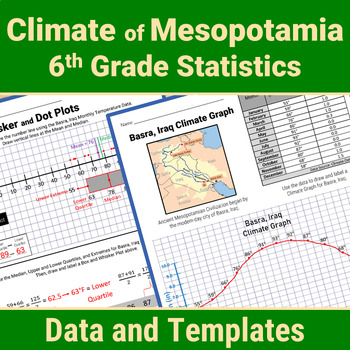
Mesopotamia Geography 6th Grade Statistics Box Plot Mean Median Mode Activity
Enrich your study of Mesopotamia using 6th Grade stats skills to analyze Mesopotamian climate data. Calculate Measures of Central Tendency (mean, median, mode, range) and Mean Absolute Deviation. Master Data Display with Box and Whisker Plots, Histograms, Dot Plots, Stem and Leaf Charts. Write Statistical Questions. Analyze Data Distribution and Data Variability.All with climate data (temperature and precipitation) from Iraq and Turkey!This Print and Go STEM/STEAM resource includes 70+ pages of
Subjects:
Grades:
6th - 8th
NGSS:
MS-ESS2-6
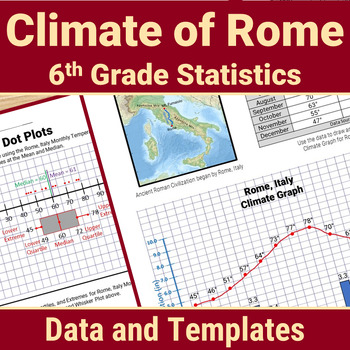
Rome Geography 6th Grade Statistics Box Plot Histogram Mean Median Mode Activity
Enrich your study of Ancient Rome using 6th Grade stats skills to analyze Italy climate data. Calculate Measures of Central Tendency (mean, median, mode, range) and Mean Absolute Deviation. Master Data Display with Box and Whisker Plots, Histograms, Dot Plots, Stem and Leaf Charts. Write Statistical Questions. Analyze Data Distribution and Data Variability.All with climate data (temperature and precipitation) from Rome!This Print and Go STEM/STEAM PBL resource includes 70+ pages of climate data
Subjects:
Grades:
6th - 8th
NGSS:
MS-LS2-1
, MS-ESS2-6

Deadliest Battles of the Civil War
Deadliest Battles of the Civil War Activity is a great resource to teach the impact of the Civil War! Combine math and statistics with social studies! Aligned with common core math and social studies standards!
Students will analyze data from the deadliest battles of the Civil War and make inferences based on their findings. All data from the battles is provided, including interesting facts from many of the battles.
Each activity includes analysis and inference questions as well as a culminati
Subjects:
Grades:
6th - 12th
Types:
CCSS:
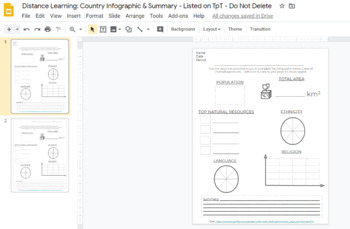
Distance Learning: Country Infographic & Summary
Use Google Slides to Create & Print an infographic focusing on the country of your choosing based on the latest information found at the CIAworldfactbook one-page summary page, Junior Scholastic Almanac, or other sources. Great for introducing a new area of study. Type onto the slide directly, use the shapes tools or print for a spiffy worksheet.- Pro Tip: Use these sheets for comparing two countries or time periods in the same area to show change over time.-Advanced Learners/Technowizards:
Grades:
Not Grade Specific
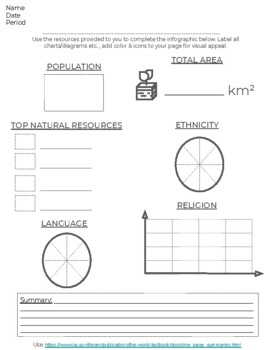
Country Infographic Worksheet
Print & Create a simple and informative infographic, with a summary for a country of your choosing based on the latest information found at the CIAworldfactbook one-page summary page, Junior Scholastic Almanac, or other sources. Great for introducing a new area of study. The second page of the PDF includes a dotted frame to assist your learners in cutting out to place in their interactive notebook!- Pro Tip: Use these sheets for comparing two countries or time periods in the same area to sh
Grades:
Not Grade Specific
CCSS:
Showing 1-10 of 10 results


