165 results
Not grade specific statistics resources under $5
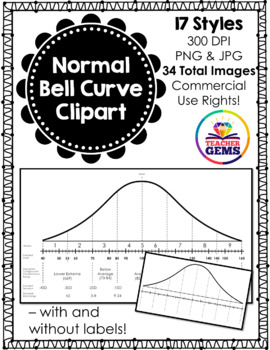
Normal Bell Curve (Normal Distribution) Clipart
Normal Bell Curve (Normal Distribution) Clipart: This Normal Bell Curve (Normal Distribution) clipart set includes 17 distinct styles (6 blank styles and 11 styles with scores) that come in both PNG (transparent) and JPEG (white background) for a total of 34 images. All image files are 300dpi. Commercial use is allowed with proper credit given (see my Terms of Use in the download – or read prior here). Below is a breakdown of all the images included in this product.Normal Bell Curve (NBC) Table
Subjects:
Grades:
Not Grade Specific
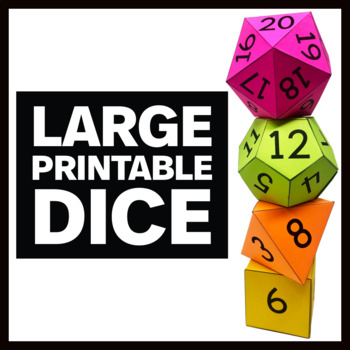
Printable Dice Templates - Blank Die Templates - 6, 8, 12, and 20 sided
This is a set of four printable dice templates. Each template comes with a numbered and a blank version. 6 sided 8 sided 12 sided 20 sided This resource is easy to use! Print out the 3D shape you want to assemble, cut out the net of the polyhedron, fold on the lines, and glue the flaps to the corresponding side.You can also use the blank shapes in your geometry or math class if you want to construct a 3D cube, octahedron, dodecahedron, or icosahedron.
Subjects:
Grades:
Not Grade Specific
Types:
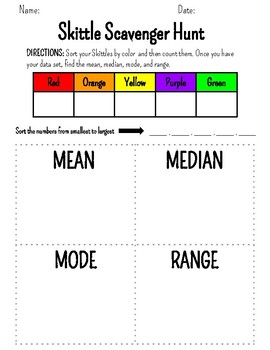
Mean, Median, Mode, and Range Skittle Activity
Have students practice mean, median, mode, and range using Skittles!
Subjects:
Grades:
Not Grade Specific
Types:
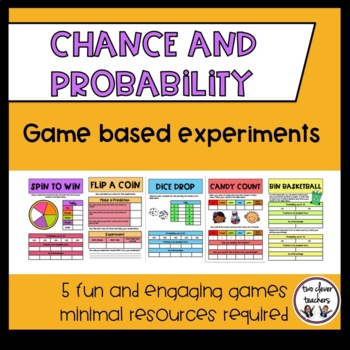
Chance and Probability l Game Based Experiments
5 Fun and engaging Differentiated Chance and Probability Games•Flip a Coin•Spin and Win•Dice Drop•Candy Count (Two Versions: Game 1 – M&M’s, Game 2 – Skittles)•Bin BasketballThe games require simple resources that can be found in the classroom with exception of Candy Count. For that game you will need to purchase small party packs of M&Ms or Skittles, options for either candy are provided.Instructions:Math Groups - Use this as part of a math rotation. Each game has simple to follow instr
Subjects:
Grades:
Not Grade Specific
Types:
Also included in: Chance and Probability Game and Experiments Bundle
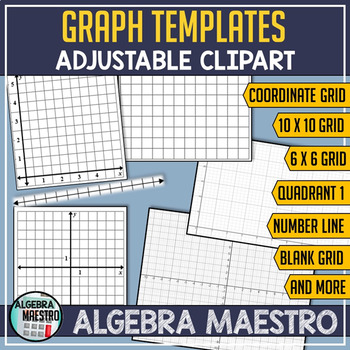
Adjustable Graph Templates
With Adjustable Graph Templates you'll receive a variety of graphs that are formatted to be easily adjustable, this is to help you create your own assignments. The full-page templates can be used as cut-outs, very useful for Foldables, and Interactive Notebooks. There are a variety of graph templates: coordinate axis (axes), 1st quadrant, number line, grid - and with a variety of units and sizes to suit your needs. To adjust a graph - click the desired graph and adjust the size by selecting-
Subjects:
Grades:
Not Grade Specific
Types:
AFL Dice Football (Maths Game - no-prep)
Are your students highly engaged and interested when you are doing anything sport related?If so this is the game for you!A no-prep game - all you need is some dice and this gameboard!Math involved:MultiplicationAdditionProbability/strategyIt is a simple but brilliant, all encompassing game and we have found our students to be super engaged.Keep track of you games with our AFL Dice Football Statistics Sheet!**************************************************************Please check out our range o
Subjects:
Grades:
Not Grade Specific
Also included in: AFL Dice Football
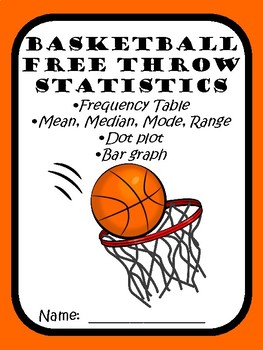
Basketball Statistics
Reinforce introductory statistics with this interactive basketball activity. Students go in the gymnasium or outside and take 10 free-throw shots. The results of this activity are depicted in a frequency table. Then students are responsible for calculating the mean, median, mode and range of the set of frequency numbers. Additionally, students are challenged to use the information to create a dot plot and/or bar graph. Finally, there are 10 questions where students need to not only interpre
Subjects:
Grades:
Not Grade Specific
Types:
Intro to Data Analysis Interactive Lesson *Any Level* Mean, Median, Mode & Range
Are you introducing your students to concepts like data sets, mean, median, and mode?Do you want your students to actually understand the meaning of these terms, not just see them as meaningless, unimportant, abstract words in a math textbook?Do you want your students to understand that calculating mean, median, mode, and range is actually useful, not just pointless math exercises?This may be the perfect lesson for you!This lesson is fully complete and ready to use, based on well-researched peda
Subjects:
Grades:
Not Grade Specific
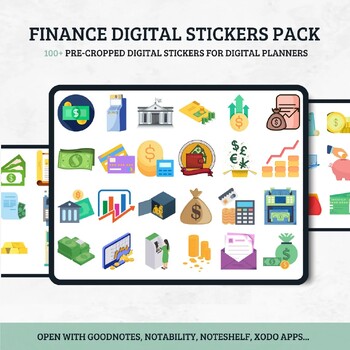
Finance DIGITAL STICKERS for GoodNotes Notability Noteshelf Budget Spending
Plan every aspect of your finances with this complete sticker bundle. Digitally sold, clipart sticker collection that features over 100 PNG stickers. The sticker collection features everything related to money. Track your expenses and money inflow and become financially responsible. Manage your budget, spending, credit, bills that have to be paid, and overall financial situation.The sticker collection works with all online, and digital planners or can be used as PNG files. Each design is individ
Subjects:
Grades:
Not Grade Specific
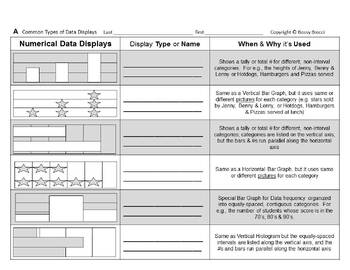
Stats&Data Slides 01: Identify & Select Common Types of Data Displays
From the Author of Bossy BrocciMath & Big Science workbooks on Amazon,comes student fillable editable interactiveGoogle Slides™ for Google Classroom™ Students can insert/overlay text & graphics[textboxes, shapes, lines, arrows, colors etc.]onto the G-Slide image backgroundorConvert to PDF, then make it interactive onlineby using various third-party Ed. websitesorPrint it for paper worksheetsAnswer KEY included=======================Students will:1) Identify and Label various Data Displa
Subjects:
Grades:
Not Grade Specific
Types:
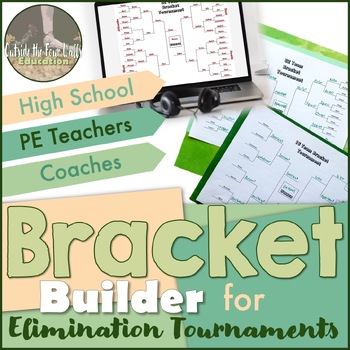
Bracket Builder for Tournaments
Looking to bring some friendly competition in your curriculum? Use these editable brackets to bring a tournament into your classroom! These editable brackets will self-populate based on the order you rank your teams. This is a great opportunity to teach about statistics and probability in real-life situations. In this spreadsheet, you will get:Linked spreadsheets so your data can be filled in on one spreadsheet and auto-populate on the bracket of choice.2 different 16 team brackets – one standar
Grades:
Not Grade Specific
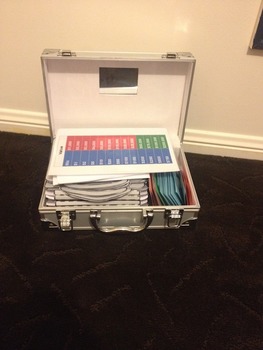
Deal or No Deal Probability Game
The package provides template to create the Deal or No Deal Probability game.
The package includes:
- Silver Briefcase printable templates
- Value Score card
- Deal or No Deal Rules sheet
- Bankers Probability Sheet
The briefcase templates can be cutout and numbered and in this case blue tack was used to keep the cases closed. The prices were laminated coloured pieces of paper with the prices written on them in permanent marker. The case itself is an old makeup case emptied out to carry the ga
Subjects:
Grades:
Not Grade Specific
Types:
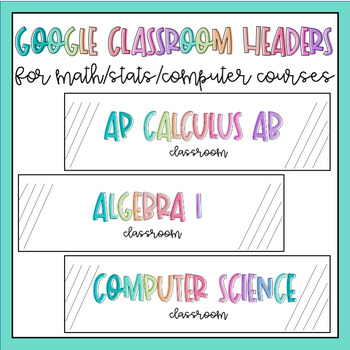
Google Classroom Headers for Math, Stats, and Computer Science Courses!
Need a cute header for your google classroom? This product contains 33 different png images that can be upload to google classroom as the header photo. (Now includes BOTH transparent and white backgrounds for all courses!)The following courses are included:Algebra 1Algebra 2Algebra 3AP Calculus ABAP Calculus BCAP Computer Science PrinciplesAP StatisticsCalculusCollege AlgebraComputer ScienceGeometryHonors Algebra 1Honors Algebra 2Honors GeometryIntegrated Math 1Integrated Math 2Integrated Math 3
Subjects:
Grades:
Not Grade Specific
Types:
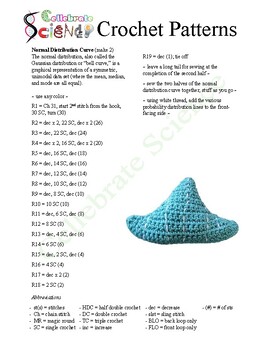
Standard Curve Crochet Pattern
Explore our crochet project showcasing a standard curve to offer students an interactive and captivating approach to learning about the standard distribution curve. Engage in a hands-on experience that will enhance understanding and retention of this important concept.
Subjects:
Grades:
Not Grade Specific
Types:
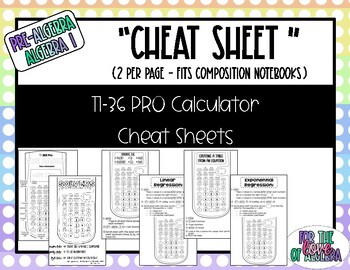
TI-36 PRO Scientific Calculator Cheat Sheets
These "cheat sheets" are half sheets of paper and fit into an interactive notebook. They are great visuals for kids when using the calculator for help with the following topics:The basic uses / functionsCreating a table from an equationSolving for xSolving systems of equationsSolving quadratic equationsLinear & Exponential Regressions (Line of Best Fit)Mean & MedianMax / MinQuartiles
Subjects:
Grades:
Not Grade Specific
Getting to know you through statistics
Getting to know you through statistics, getting to know your students at the beginning of the teaching year can often resort to the tried and true activities. Why not try something new and find out more about your students likes/dislikes, interests, hobbies through learning. This resources supports you and your students to work through statistics, and working through the PPDAC cycle. It gives you options for making graphs as well as using digital platforms to create your graphs and show your dat
Subjects:
Grades:
Not Grade Specific
Types:
Introduction to Circle Graphs
This introduction will teach students how to read a circle graph. It will lead students step by step on how to find a missing percent on a graph.
Subjects:
Grades:
Not Grade Specific
Types:
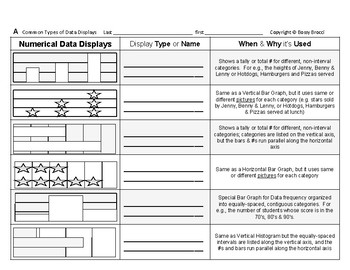
Stats&Data 01: Identify & Select Common Types of Data Displays
This is an excerpt from my popular line ofBossy Brocci Math & Big Science workbooks on Amazon.Answer KEY included=======================Students will:1) Identify and Label various Data Displays, including: Vertical Bar GraphVertical PictographHorizontal Bar GraphHorizontal PictographVertical HistogramHorizontal HistogramLine Plot (X Plot)Stem and Leaf PlotCircle Graph or Pie ChartandLine Graph2) Read about and Learn the appropriate usagefor each of those Data Displays3) Be compelled to show
Subjects:
Grades:
Not Grade Specific
Types:
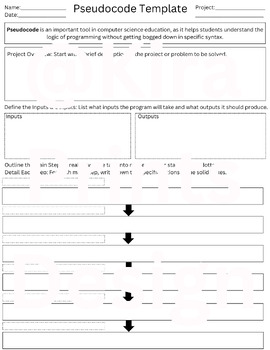
Pseudocode Template Kit: Streamline Coding Projects for All Ages
Overview: Dive into programming concepts with ease using my Universal Pseudocode Template Kit! Perfect for computer science classrooms across all levels, this kit offers an accessible way to introduce and practice coding logic for any project. Ideal for both teachers and students, it simplifies the transition from conceptualization to actual coding.Features: Customizable templatesStep-by-step student instructionsReflection Questions Room for creativity in codingAdaptable to multiple programming
Grades:
Not Grade Specific
Types:
NGSS:
HS-ETS1-2
, HS-ETS1-3
, HS-ETS1-1
, HS-ETS1-4
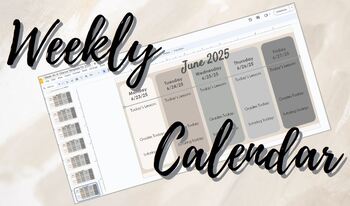
Weekly Calendar for 24-25 School Year (August-June)
Does your school require you to have a week-at-a-glance posted for students and parents? Mine does, so I try to make it fit my personality and have some fun with it. This template has all weeks from August 5, 2024-June 27, 2025 - once you buy, you can delete weeks you do not need. Table rows are formatted to keep your writing lined up with the sections in the background. Rows are "Today's Lesson," "Grades Today," and "Tutoring." Feel free to change them to match your needs.:) Happy Teaching
Subjects:
Grades:
Not Grade Specific
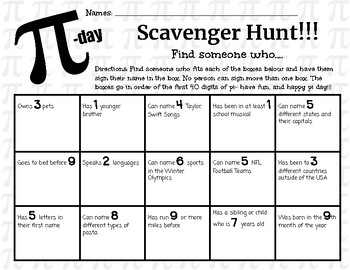
Pi-Day Scavenger Hunt Activity
Pi-Day Activity for ANY Age Level!!!A "find someone who..." scavenger hunt activity for Pi-Day! I have done this with high-school students for extra credit, and they really enjoyed it. They love asking other students/staff to sign their sheet outside of class!
Subjects:
Grades:
Not Grade Specific
Types:
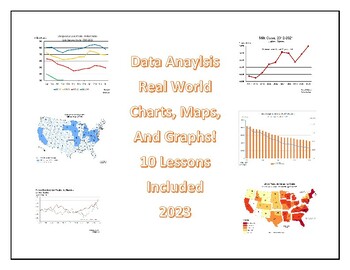
Data Analysis Lessons on Real World Charts, Graphs, and Maps - 2022-23 Data
Looking for more practice with Data Analysis?Well, included in this lesson are (10) different charts, maps, and graphs. Each come with questions to answer based off the chart, map, or graph provided. A total of (10) different charts, maps and graphs are included. Over (50) total questions are included. Great as a bell ringer to start your class! Answer key is included as is source information. Thanks!
Subjects:
Grades:
Not Grade Specific
Types:
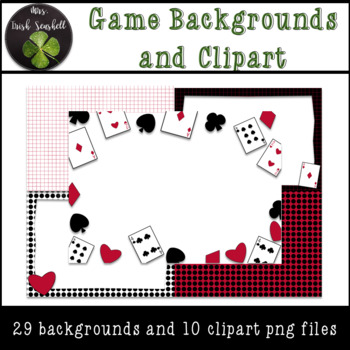
Game Night Backgrounds and Clipart
Do you have a probability or statistics unit coming up ? Or a game day or night planned? Use these 5 x 7 casino themed backgrounds for Boom Cards, invitations, Google headers, labels, task cards, etc. This file comes with 29 backgrounds and borders in red and black and 10 dice and card clipart pngs with a transparent background.
Subjects:
Grades:
Not Grade Specific
Also included in: Digital Paper Backgrounds and Clipart Bundle - Commercial Use
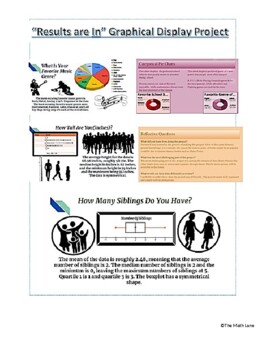
"The Results are In" Graphical Display Stats End of Year Project (All Grades)
Get ready to take your data analysis skills to the next level with our Graphical Display Project! Designed for students who want to create visually stunning displays of their data, this project allows you to not only collect data using Google Surveys, but also analyze and present it using Google Sheets. With detailed instructions, project examples, and a comprehensive rubric included, you'll have everything you need to create professional-looking graphical displays of both numerical and categori
Subjects:
Grades:
Not Grade Specific
Types:
CCSS:
Also included in: High School Math Projects (Algebra II and Statistics) STEM No prep
Showing 1-24 of 165 results


